ADVERTISEMENT

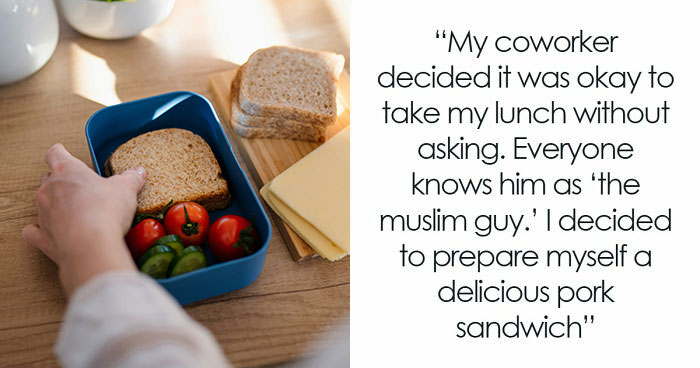
The oldest maps out there are roughly 4000 years old, depicting a section of the river Odet valley in modern Finistère, Brittany. It was found in a tomb, possibly to communicate to people what its inhabitant “controlled.” The fact is that all through history, humans have been trying to make records of the world around them in interesting ways.

The “Simon shows you maps” Facebook page, run by the titular Simon, is dedicated to sharing cool and interesting maps. So get comfortable as you scroll through, upvote the best ones and be sure to share your thoughts and ideas in the comments section down below.

More info: Facebook

#1

Stumbled Across A Dumb Little Post

Political map concept dividing the US into Trump supporters on the right and Harris supporters on the left.

Simon shows you maps Report

Ray Ceeya (RayCeeYa)
Community Member
4 months ago Created by potrace 1.15, written by Peter Selinger 2001-2017

Easier solution os for the West Coast form one country. A second country around the Great Lakes and a Third in New England. The rest of the rest of what's left will quickly discover where the money was coming from.

View more comments
RELATED:
    #2

    For A While During The Northern Hemisphere’s Summer, The Sun Sets In Eastern Brazil Before It Does In Ireland. Now You Know

    Satellite view of Earth showing North and South America, Europe, Africa, and the North and South Atlantic Ocean maps.

    Simon shows you maps Report

    #3

    There Are European Cities That Have Been Continuously Inhabited For 7000-8000 Years!

    Map showing the longest continuously inhabited cities in Europe with country flags and historic dates.

    Simon shows you maps Report

    Fat Harry (Oi / You)
    Community Member
    4 months ago Created by potrace 1.15, written by Peter Selinger 2001-2017

    I was about to say "I thought Damascus was the longest continually inhabited city?" then remembered that Syria is in Asia and I'm an idiot.

    View more comments

    From the time our ancestors first marked lines in the dirt to stake out hunting ground or chart the changing seasons, mapping has been at the root of how we understand the world. Here's why we can't help but take data and turn it into multicolored maps overlaid on familiar landscapes:

    ADVERTISEMENT

    Maps directly tap into our spatial intuition. When you see numbers or patterns overlaid on a geographical landscape, whether dots for earthquake epicenters or color-shaded countries by population density, the relationships pop out at you. Suddenly, what were once abstract statistics become something you can almost "see" and even "feel" in your mind's eye.

    #4

    Etymology Of Spain. This Map Shows The Origin Of Various Spanish Province Names

    Map of Spain showing etymology of province names with origins in Latin, Arabic, Greek, Phoenician, Basque, Celtic, and Iberian languages.

    Simon shows you maps Report

    Verena
    Community Member
    4 months ago Created by potrace 1.15, written by Peter Selinger 2001-2017

    Now tell what Gerunda, Barkenos and Batalyaws means

    View more comments
    #5

    Topographical map of Krubera-Voronya cave showing underground camps and depth comparison with the Eiffel Tower height.

    Wait, this is a real thing? A cave deeper than 2000m? And people are crazy enough to go all the way down? Good lord! It’s a hard no from me. Happy to support mountaineers all the way to the top but caving is a big no no for your friendly armchair cartography enthusiast

    Simon shows you maps Report

    Corwin 02
    Community Member
    4 months ago Created by potrace 1.15, written by Peter Selinger 2001-2017

    2km for fun or how about 4 Km for work , the deepest mine in the world is the Mponeng Gold Mine in South Africa. It reaches a depth of over 4 kilometers (approximately 2.5 miles) below the surface.

    View more comments
    ADVERTISEMENT
    ADVERTISEMENT
    #6

    As A German, For A Personal Meeting 12 Means 12 But For A Professional Meeting 12 Means Be 5 Minutes Early. Any Alternative Interpretation Hurts My Little German Brain

    Map of Europe showing cultural differences about being on time with color codes, featured on Simon Shows You Maps.

    Simon shows you maps Report

    Pernille
    Community Member
    4 months ago Created by potrace 1.15, written by Peter Selinger 2001-2017

    I was born, and lived in the blue part for almost 40 years. While I have assimilated pretty well to all aspects of life in France, the fact that everyone is late is not easy to get used to. I carry a book, and try not to be annoyed, but it still annoys me.

    View more comments

    A table or a sequence of bars will tell you "what," yet just a map can guide you through the "where" and "why." Think about a heat map of global coffee consumption: you instantly sense cultural hotspots in Scandinavia and Brazil. You can almost taste the latte in Oslo and the cafézinho in São Paulo. A map weaves narrative into bare facts, rendering facts an unforgettable experience.

    #7

    This Map Shows What The Word "Yankee" Means Around The World

    World map infographic showing regional meanings of Yankee across America and the rest of the world from Simon Shows You Maps.

    Simon shows you maps Report

    Daria
    Community Member
    4 months ago Created by potrace 1.15, written by Peter Selinger 2001-2017

    [i was curious and googled it]: the word "yankee" likely derives from the Dutch diminutive "Janke" or "Janneke," which means "Little John" (a diminutive of the common Dutch name Jan, equivalent to English "John"). This nickname was probably first used by Dutch settlers in New Netherland (modern New York) as a derogatory term for English colonists in neighboring New England, particularly in Connecticut. The term was first used derogatorily by the British in the mid-18th century and appears as early as the 1750s to describe American colonists, often paired with terms like "doodle" and "dandy". During the American Revolution, Americans reclaimed the word as a badge of pride. The word "Yankee" later evolved to mean Northerners or Union soldiers during the Civil War.

    View more comments
    #8

    If You Are Being Born Today, This Is The Likelihood Of You Ending Up In Each Continent

    Chances of being born in each continent shown on colorful map infographic with data and world maps visuals.

    Simon shows you maps Report

    Heir of Durin
    Community Member
    4 months ago Created by potrace 1.15, written by Peter Selinger 2001-2017

    An interesting perspective. And one I’ve never thought of before!

    View more comments
    ADVERTISEMENT
    #9

    Bar chart showing vaccine opposition rates in various countries, highlighting data in an infographic style with maps and statistics.

    Almost one third of Russians are opposed to vaccines. The second ranked country is the world’s most advanced economy happily shooting itself not in the arm but in the foot. My birth country of Germany also has unnecessarily high opposition

    Simon shows you maps Report

    Michael Largey
    Community Member
    4 months ago Created by potrace 1.15, written by Peter Selinger 2001-2017

    Not surprising, since both places are ruled by the same person.

    View more comments
    ADVERTISEMENT

    Maps transcend borders, languages, and technojargon. Everyone, anywhere, no matter their background, understands a red‑to‑blue ramp for vote share or a constellation of icons for Wi‑Fi coverage. This universality is an asset for maps when communicating quickly, essential in a crisis, live news, or even executive briefings. Entire teams can be on the same page at a glance as to where to allocate resources.

    #10

    Line graph from Simon Shows You Maps depicting increasing mortality rates for young adults aged 18-34 in the United States and France.

    Young adults are dying at an increasing rate in the United States. France roughly mirrored the US before the introduction of Oxycontin in the mid-90s and later fentanyl. The US isn't doing a great job looking after its own people

    Simon shows you maps Report

    The Darkest Timeline
    Community Member
    4 months ago Created by potrace 1.15, written by Peter Selinger 2001-2017

    There is a large contingent of people who vehemently reject the notion of the government being at all responsible for “taking care of its people” outside of military services to protect borders. I think those people should all move to the Dakotas, build a fence around them, promise them they won’t be “invaded,” then they can live out their rugged individualist cosplay while the rest of us move on.

    View more comments
    ADVERTISEMENT
    #11

    Map Shows The World In About 250 Million Years

    Map showing the future world map in 250 million years with continents colliding and new mountain ranges rising.

    Simon shows you maps Report

    michael Chock
    Community Member
    4 months ago Created by potrace 1.15, written by Peter Selinger 2001-2017

    Can't wait to take the train from California to Tokyo

    View more comments
    #12

    3D map showing the affected area of the Great Fire of London in 1666 with highlighted streets and landmarks.

    The Great Fire of London ragged in 1666. This fantastic map overlays the effected area on modern day London. Would be cool to walk the area to feel the extent

    Simon shows you maps Report

    Humans are wired to detect patterns. A crowd‑sourced map of real‑time traffic flow makes rush‑hour bottlenecks stand out, and a map of deforestation reveals the spread of agriculture into rainforest. By layering different datasets, rainfall over crop yields, say, we become detectives, observing correlations and asking "What's happening here?" It's a powerful superpower for researchers, planners, and curious minds of all types.

    #13

    Let’s See If This Map Will Come In Handy Any Time Soon

    Map showing how to say peace in different European languages with colorful country labels and a data visualization style.

    Simon shows you maps Report

    XenoMurph
    Community Member
    4 months ago (edited) Created by potrace 1.15, written by Peter Selinger 2001-2017

    Upvote for the smaller languages being included. In Ireland the official term for the police is "Garda Siochana", "Guardians of the peace", mostly referred to as "The guards"

    View more comments
    ADVERTISEMENT
    ADVERTISEMENT
    #14

    Fun Infographic Shows When We Tend To Peak At Certain Things

    Age peaks for various skills and traits shown in an infographic from Simon Shows You Maps with data and cool maps.

    Simon shows you maps Report

    Heir of Durin
    Community Member
    4 months ago Created by potrace 1.15, written by Peter Selinger 2001-2017

    Happiness with your body at 74!? Psychological well-being at 82!? I guess there is hope for me yet.

    View more comments
    #15

    Roosters Without Borders

    Map showing how rooster crow sounds are expressed in various European languages, featuring interesting maps and data insights.

    Simon shows you maps Report

    AmazingUsername2008
    Community Member
    4 months ago Created by potrace 1.15, written by Peter Selinger 2001-2017

    Brilliant work from the censorship here, glad to have been saved from rooster noises

    View more comments

    Let's be real: well-designed maps are just plain fun to look at. Bright color schemes, swooping coastlines, and tidily arranged legends invite you to dive in. Cartographers often sneak in Easter eggs, a tiny sketch of a landmark, say, that rewards a closer look. Interactive web maps bring the fun to a whole new level, letting you zoom in from global overviews to street-level detail, toggle layers on and off, or watch animated shifts over time.

    #16

    I Live Such A Sheltered Life That I Had Never Heard Of A Horse Chopping Sabre Before

    Chart of popular historical swords from various regions, displaying silhouettes, names, and time periods with Simon shows you maps data.

    Simon shows you maps Report

    Pyla
    Community Member
    4 months ago Created by potrace 1.15, written by Peter Selinger 2001-2017

    https://en.m.wikipedia.org/wiki/ZhanmadaoThe awful truth:

    Ray Ceeya (RayCeeYa)
    Community Member
    4 months ago Created by potrace 1.15, written by Peter Selinger 2001-2017

    I'm assuming that a "horse chopping sword" is intended to cut down cavalry. Like Pikes, Spears and Halberds.

    WindySwede
    Community Member
    4 months ago Created by potrace 1.15, written by Peter Selinger 2001-2017

    Not according to the link Pyla shared below! 😬

    Load More Replies...
    DetriMentaL (It/That)
    Community Member
    4 months ago Created by potrace 1.15, written by Peter Selinger 2001-2017

    We have declined so far as a civilization that 21st century design may as well be a toothbrush shank called StabbymcStabface

    Michelle C
    Community Member
    4 months ago Created by potrace 1.15, written by Peter Selinger 2001-2017

    Is anyone else fascinated that the basic structure of a sword has never changed?

    Michael Largey
    Community Member
    4 months ago Created by potrace 1.15, written by Peter Selinger 2001-2017

    But swords are no basis for a system of government. Supreme executive power derives from a mandate from the masses.

    Trisec Tebeakesse
    Community Member
    4 months ago Created by potrace 1.15, written by Peter Selinger 2001-2017

    No Kris? Bah. https://en.wikipedia.org/wiki/Kris

    Lady Eowyn
    Community Member
    4 months ago Created by potrace 1.15, written by Peter Selinger 2001-2017

    I love edged weapons and was familiar with most of these. A basket-hilted sword is NOT a claymore! They're probably referring to a Scottish backsword, which does have a basket hilt. A claymore is larger and heavier, with a handle that can be gripped with one or both hands. Sometimes called a hand-and-a-half.

    ColdSteelRonin
    Community Member
    4 months ago Created by potrace 1.15, written by Peter Selinger 2001-2017

    I always thought the Kriegsmesser was called a Gross Messer.

    BeesEelsAndPups
    Community Member
    4 months ago Created by potrace 1.15, written by Peter Selinger 2001-2017

    Fun fact. Straight swords are effective against people wearing armor, whereas a curved blade is a stronger blade for hand to hand combat. Countries that did not use metal armor in combat never bothered with straight swords. Japan, for instance, was an island nation with limited access to metals. Building a full suit of steel armor would have been prohibitively expensive. The Arabian countries didn't use armor either, because anyone in metal armor would die from the heat before any battle started.

    Rich Black
    Community Member
    4 months ago Created by potrace 1.15, written by Peter Selinger 2001-2017

    and then somebody invented the longbow. and then gunpowder

    nm
    Community Member
    4 months ago Created by potrace 1.15, written by Peter Selinger 2001-2017

    Before gladius there were xiphos (from 1200 BCE) and kopis (7th century BC). https://en.wikipedia.org/wiki/Xiphos - https://en.wikipedia.org/wiki/Kopis

    View more comments
    ADVERTISEMENT
    #17

    Germany’s Economy Faces Many Struggles Buuuuut It Is Still Huge As This Map Reminds Us

    Map showing Germany's economy compared to combined GDP of multiple European countries highlighted in yellow in 2024.

    Simon shows you maps Report

    Ace
    Community Member
    4 months ago Created by potrace 1.15, written by Peter Selinger 2001-2017

    In case anyone's interested, the combined population of the yellow countries is just less than twice that of Germany.

    View more comments
    ADVERTISEMENT
    #18

    Challenge: Which Definition, Which Terminology Doesn’t Offend Anyone? I’ve Found That Someone Will Always Be Mad

    Map of the British Isles showing regions including Great Britain, Northern Ireland, Wales, and the Republic of Ireland.

    Simon shows you maps Report

    andrew jack
    Community Member
    4 months ago Created by potrace 1.15, written by Peter Selinger 2001-2017

    I am proud to be British, but more proud to be Scottish. It annoys me that people in the USA confuse England with Britain/United Kingdom.

    View more comments

    From emergency responders deciding where to send rescue teams, to retailers deciding where to open new outlets, maps are vital decision‑making aids. They help us allocate resources efficiently, assess risks, and plan for the future. Mapping epidemiological data during an epidemic, for instance, can quite literally save lives by revealing hotspots and guiding vaccination campaigns.

    #19

    Map highlighting Ukraine strikes on Russian strategic aviation with key locations and drone usage data from Simon Shows You Maps.

    This map of Ukrainian deep strike capability is astonishing. Drone warfare is so hard to defend against. Any country not heavily investing in defensive and offensive drone technology is simply naive.

    Simon shows you maps Report

    ADVERTISEMENT
    #20

    Area chart from Australian Bureau of Statistics showing smoking status across age groups in an infographic map style.

    The Australian efforts towards tackling the public health issue that is smoking were super successful. Something the country should be proud of. Look at the huge number of ex smokers Australian policies created. Good stuff.

    Simon shows you maps Report

    Zero Costa
    Community Member
    4 months ago Created by potrace 1.15, written by Peter Selinger 2001-2017

    my dad recently got back into smoking after quitting cold turkey like two decades ago... disappointed

    View more comments
    #21

    Just A Quick Reminder. A Little Public Service Announcement To Please My Dutch Friends

    Infographic map showing the difference between Holland and Netherlands with provinces and major cities highlighted.

    Simon shows you maps Report

    Jaya
    Community Member
    4 months ago (edited) Created by potrace 1.15, written by Peter Selinger 2001-2017

    Holland isn't a thing, it's simply the incorrect name (although historically it makes sense) for the Netherlands. It's not that North Holland and South Holland together form a region called Holland, that's not how it works. (Kinda like how you don't say South Dakota and North Dakota together are called Dakota (for as far as I know, I'm not American obviously)). Here in the Netherlands we don't use the word Holland to refer to those 2 provinces together, we only use Holland as an alternative name for the whole Netherlands. And when Dutch people call themselves or someone else a Hollander, they mean Dutch, not that they're specifically from North Holland or South Holland.

    View more comments
    ADVERTISEMENT

    Above all, maps mirror the world and our choices back at us. They remind us why some places thrive and others struggle, how our actions remake the planet, and where injustices cluster. By mapping everything from literacy to air quality, we are faced with the issues that confront us, and can more readily imagine solutions.

    #22

    Map of Europe showing different categories of euphemisms by country, featuring colorful data and infographics on Simon Shows You Maps.

    The classification of Germany in this map classifying the nature of most commonly used profanities across Europe is certainly correct. I would argue a whole category is missing here: family related profanities. Sure, they are often mixed with sexual insults but I thing they deserve their own category!

    Simon shows you maps Report

    SchadenFreudian Psychology
    Community Member
    4 months ago Created by potrace 1.15, written by Peter Selinger 2001-2017

    Medical things being used as profanity? That’s a new one on me.

    View more comments
    ADVERTISEMENT
    #23

    Technically Correct

    Map showing North Korea's proximity to Europe, illustrating the route crossing one country to reach Finland, from Simon Shows You Maps.

    Simon shows you maps Report

    Ray Ceeya (RayCeeYa)
    Community Member
    4 months ago Created by potrace 1.15, written by Peter Selinger 2001-2017

    Good luck with that. Siberia is huge. It makes Texas look like a Tyco Toy. I said what I said.

    View more comments
    #24

    Truth

    Map from Simon Shows You Maps illustrating how people in Europe react when you try to speak their language, using color-coded regions.

    Simon shows you maps Report

    Enuya
    Community Member
    4 months ago Created by potrace 1.15, written by Peter Selinger 2001-2017

    It's not true. Poles generally enjoy it when you speak in Polish with them. Many even find it admirable that you try to learn our language. And Germans definitely appreciated when I tried talking in German with them and were vey understanding.

    View more comments

    In short, mapping data turns the maze of numbers into a comprehensible cosmos. It is a synthesis of insight, storytelling, art, and strategy, no wonder we come back to maps time and again when we want to make sense of our complex, interrelated world.

    #25

    Germans And Scandinavias Holidaying In Spain Lose Their Mind Over The Late Dinners

    Map showing most common dinner time across Europe with varied times highlighted by Simon Shows You Maps infographic.

    Simon shows you maps Report

    ADVERTISEMENT
    #26

    In A World Where More People Obsess About Their Work Being Inherently Meaningful, I Hope That You See Your Job Relatively Close To The Left Side Of The Chart

    Bar chart showing percentage of people doubting their job value by occupation from Simon Shows You Maps data.

    Simon shows you maps Report

    ADVERTISEMENT
    #27

    Map showing European countries with highest pension spending per retiree in 2022, including data in euros, PPS, and GDP percentages.

    In places like Germany, the full retirement of the huge Baby Boomer cohort will drive pension payments up significantly. The relatively small workforce will pay for that. Young workers will increasingly dislike that. Voting behaviour might shift further away from established parties as a result.

    Simon shows you maps Report

    Rtblast66
    Community Member
    4 months ago Created by potrace 1.15, written by Peter Selinger 2001-2017

    Shame you can't see Uk in there anymore (Brexit etc.) UK has one of the worst. And they call it a "benefit" after working all your life, then you are deemed "benificial "to have one. UK ......

    View more comments
    #28

    This Map Shows The Number Of Dentists Per 10,000 Residents Across Europe

    Map showing number of dentists per 10,000 people in Europe with data highlights and color-coded regions by Simon Shows You Maps.

    Simon shows you maps Report

    Daria
    Community Member
    4 months ago Created by potrace 1.15, written by Peter Selinger 2001-2017

    i wonder if it means dentistry is more (or less) affordable in the lighter blue areas?

    View more comments
    #29

    Look Who Just Made It Into The Top 20 Of The World’s Largest Economies. Welcome To The Top, Poland

    Top 20 countries by forecasted values in 2025 shown in a detailed data table from Simon Shows You Maps infographic.

    Simon shows you maps Report

    Bartlet for world domination
    Community Member
    4 months ago Created by potrace 1.15, written by Peter Selinger 2001-2017

    And the smallest country with the fewest people on this list is...

    View more comments
    ADVERTISEMENT
    #30

    Heatmap showing U.S. baby boom fertility rates from 1940 to 2020 with emphasis on 1946 to 1964 in a detailed map visualization.

    I had never seen the US Baby Boom been visualized in this way. Rather cool visuals. The chart assumes Baby Boomers to be born between 1946 and 1964

    Simon shows you maps Report

    Jane Hower
    Community Member
    4 months ago Created by potrace 1.15, written by Peter Selinger 2001-2017

    It was a the summer of soldiers coming home from war

    View more comments
    ADVERTISEMENT
    #31

    This Map Shows Europe In A Silly Scenario Where Sea Levels Decrease By 1000 Meters

    Colorful political map of Europe and surrounding countries showing country borders and names for Simon Shows You Maps.

    Simon shows you maps Report

    #32

    Want To Swear But Kids Are Around? Use These Kid-Friendly Swear Words!

    Map showing kid friendly cursewords in different European languages with colorful country labels and playful alternatives.

    Simon shows you maps Report

    #33

    By 2050 India Will Be One United States Bigger Than China

    Graph showing India outgrowing China by a United States in population, with data and infographics on demographic trends.

    Simon shows you maps Report

    Verena
    Community Member
    4 months ago Created by potrace 1.15, written by Peter Selinger 2001-2017

    We cannot afford that. Right now, 2.5 Earths would be necessary to provide a decent quality of live for all 8 billion people. This is three times more than during the glorified 1950s, when eveything seemed to be possible and still people starved.

    View more comments
    ADVERTISEMENT
    #34

    This Map Shows The Number Of Ant Species In The 50 Most "Antsy" Countries

    Map from Simon Shows You Maps highlighting the 50 countries with the most ant species and ant species counts.

    Simon shows you maps Report

    ADVERTISEMENT
    #35

    Time Traveling Back To 600 Ad Europe, Would You Be Able To Communicate With Anyone?

    Map showing common languages and branches in Europe around 600 AD with color-coded regions for Simon Shows You Maps.

    Simon shows you maps Report

    Petra Peitsch
    Community Member
    4 months ago Created by potrace 1.15, written by Peter Selinger 2001-2017

    Yeah, but won't be easy ...Also, my ancestors would be very surpried, learning, that they'll land in the middle of Europe, just 300 years later.

    View more comments
    #36

    Map showing coal power plants status in Europe with active, phased out, and never had coal power plants by country.

    This map shows the status of coal power in Europe as of 2024. Coal is being phased out. Now it’s time to drive down energy costs. Crucial considering the continent wants to be competitive in high end manufacturing, needs big data centers, and wants at least a bit of supply chain sovereignty.

    Simon shows you maps Report

    Fat Harry (Oi / You)
    Community Member
    4 months ago Created by potrace 1.15, written by Peter Selinger 2001-2017

    Our push towards green energy is something I'm actually quite proud of the UK for. And I'm not a national pride kind of person.

    View more comments
    #37

    Map showing countries whose capitals are not on their mainland, featuring data and infographics from Simon Shows You Maps.

    Simon shows you maps Report

    Wild Cream
    Community Member
    4 months ago Created by potrace 1.15, written by Peter Selinger 2001-2017

    Just like BC, Canada :) (although that’s not a country capital haha, just our provincial capital)

    View more comments
    ADVERTISEMENT
    ADVERTISEMENT
    #38

    Yet Another Map That Supports My Suspicion That Poland Is Europe’s Hottest Place To Be At The Moment. Cheaper Than Germany, On The Up Economically

    Map showing price differences in every EU country relative to the EU average using data and infographics.

    Simon shows you maps Report

    Verena
    Community Member
    4 months ago (edited) Created by potrace 1.15, written by Peter Selinger 2001-2017

    It depends on what products this is about. If it is seasonal, locally grown food, then there is no surprise that an agricultural oriented country as Poland is cheap. Or electronics? And without relation to the local income, not very informative.

    View more comments
    #39

    Where To Pee? European Edition

    Map of Europe showing public toilets as usually single-s*x in blue and unisex in orange, from Simon Shows You Maps data.

    Simon shows you maps Report

    #40

    Map showing nationality related idioms in Slovakia with examples from various European countries and their meanings.

    We are being shown how people in Slovakia reference other European nations in their idioms. Germans also use the stingy Scotsman stereotype

    Simon shows you maps Report

    Robert T
    Community Member
    4 months ago Created by potrace 1.15, written by Peter Selinger 2001-2017

    One from the UK: "Only a Scotsman makes a Yorkshireman look generous" ;-)

    View more comments
    #41

    Colored map showing European birth rates by region using data from Eurostat, featuring detailed infographic and data visualization.

    The very low birth rates across Europe lock in future population decline now. The Mediterranean countries will be pretty empty. Well, except for the summer months when everyone still comes to Italy and co for a holiday.

    Simon shows you maps Report

    A.J.
    Community Member
    4 months ago Created by potrace 1.15, written by Peter Selinger 2001-2017

    I like how they exclude uk from Europe every time but includes turkey, one is like 100% in Europe but excluded because of politics and the other one is like 5% but included to not offending it.

    View more comments
    ADVERTISEMENT
    ADVERTISEMENT
    #42

    Holidaymakers In The Mediterranean Should Study This Map Carefully To Impress (Annoy?) Their Friends And Family With Island Related Geography Trivia!

    Map showing the 10 largest islands in the Mediterranean Sea with area sizes and country flags, Simon Shows You Maps data visualization.

    Simon shows you maps Report

    #43

    The Great War, Wwi, Changed The Map Of Europe Significantly

    Europe maps showing territorial changes in Europe pre-World War I and post-World War I with country borders and cities.

    Simon shows you maps Report

    Ace
    Community Member
    4 months ago Created by potrace 1.15, written by Peter Selinger 2001-2017

    Somewhat misleading, many of these shifts were not a direct result of the war. But the crazy artificial borders and countries immediately pre-war gives a good idea about why the war came about in the first place,

    View more comments
    #44

    Most Of Europe Is Shrinking As Is. Without Migration The Shrinkage Would Be Huuuge By 2100

    Map showing European population forecast by 2100 with and without migration, highlighting key demographic data and trends.

    Simon shows you maps Report

    Jane Hower
    Community Member
    4 months ago Created by potrace 1.15, written by Peter Selinger 2001-2017

    Migration of Islam will be the downfall of all who do it. It's happening already. Sadly.

    View more comments
    #45

    Not So Forbidden After All…

    Bar chart showing most visited monuments worldwide with visitor numbers and country flags in a Simon Shows You Maps infographic.

    Simon shows you maps Report

    ADVERTISEMENT
    ADVERTISEMENT
    #46

    That's One Way Of Saying That Poland Really Saw Impressive Economic Growth In Recent Years

    Map showing Poland's economy nearly equal to combined economies of nearby blue countries with population and GDP data.

    Simon shows you maps Report

    Kim Kermes
    Community Member
    4 months ago Created by potrace 1.15, written by Peter Selinger 2001-2017

    Ukraine has been a bit distracted from business of late

    View more comments
    #47

    Wow. That Puts Market Sizes Into Perspective

    Line graph showing US total vehicle sales compared to rapidly increasing China EV sales from 2016 to projected 2026 map data.

    Simon shows you maps Report

    Jane Hower
    Community Member
    4 months ago Created by potrace 1.15, written by Peter Selinger 2001-2017

    Tarrifs will help balance this.

    #48

    This Map Overlays The 49th Parallel (Essentially The Us–canada Border) On Europe

    Map of Northern European countries highlighted in blue above a red horizontal line, illustrating Simon Shows You Maps data.

    Simon shows you maps Report

    #49

    Good News, Australia! The Motherland Still Likes Us!

    Bar chart showing Britons' views on UK allies and enemies with percentages for friendly and hostile countries.

    Simon shows you maps Report

    Ace
    Community Member
    4 months ago Created by potrace 1.15, written by Peter Selinger 2001-2017

    Saddened to see the US still so high up the list, and the EU as an entity so far down.

    View more comments
    ADVERTISEMENT
    ADVERTISEMENT
    See Also on Bored Panda
    #50

    How Long Is Your Summer School Break?

    Map showing school holiday duration in weeks across Europe with color-coded data from Simon Shows You Maps.

    Simon shows you maps Report

    Judes
    Community Member
    4 months ago Created by potrace 1.15, written by Peter Selinger 2001-2017

    Why does the title say 'summer' school break? These are total number of weeks of holiday for the whole year! For example, you might have 4 terms of 9 or 10 weeks, plus somewhere between 16 and 12 weeks of holiday.

    View more comments
    #51

    Now That European Ice Cream Season Is In Full Swing, This Map Seems Like Essential Knowledge

    Map of Europe showing different ice cream brand names by country, featured in Simon Shows You Maps data and infographics.

    Simon shows you maps Report

    #52

    Europe Felt The Heat In 2024. Ok, Iceland Didn’t

    Map showing Europe 2024 hottest year with anomalies and extremes in surface air temperature by Simon Shows You Maps.

    Simon shows you maps Report

    #53

    World population share by quadrant map showing North-East 73%, North-West 13%, South-East 9%, and South-West 5% data visualization.

    Simon shows you maps Report

    XenoMurph
    Community Member
    4 months ago Created by potrace 1.15, written by Peter Selinger 2001-2017

    Also.... land. Fewer people live in the sea

    ADVERTISEMENT
    ADVERTISEMENT
    See Also on Bored Panda
    #54

    Gay Marriage Is Slowly Moving Eastward

    Map showing European countries that have legalised LGBT marriage, highlighting years and legal status with colorful infographic data.

    Simon shows you maps Report

    martin734
    Community Member
    4 months ago Created by potrace 1.15, written by Peter Selinger 2001-2017

    Can I just point something out here. Gay marriage was legalised in Great Britain in 2014, it was legalised in the whole of the UK in 2020.

    View more comments
    #55

    Life Expectancy At Birth In Europe As Of 2024. It Helps To Be Rich And To Eat Healthy

    Life expectancy at birth map of Europe 2024 showing country data with color-coded regions for easy comparison.

    Simon shows you maps Report

    #56

    Line graph showing projected GDP growth impact from 2024 to 2034 by various economic advisory sources on maps and data.

    A Government being excited about their own ideas is normal. This chart made me laugh though. The White House’s economic impact assessment of their Big Beautiful Bill is comically out of whack with all major economic forecasters.

    Simon shows you maps Report

    Ray Ceeya (RayCeeYa)
    Community Member
    4 months ago Created by potrace 1.15, written by Peter Selinger 2001-2017

    Please note how 3 out of six peak at the 2026 midterms. That is deliberate. The worst parts are scheduled for next year.

    View more comments
    ADVERTISEMENT
    See Also on Bored Panda
    #57

    This Map Looks Like The Setup For Europe’s Weirdest Cop Show

    Map of Europe showing countries where it is illegal to pee in the sea, highlighted for Simon Shows You Maps infographic.

    Simon shows you maps Report

    Catarina Ramos
    Community Member
    4 months ago Created by potrace 1.15, written by Peter Selinger 2001-2017

    I’m from Portugal and this is an absolute lie

    View more comments
    ADVERTISEMENT
    See Also on Bored Panda
    #58

    Map Of The UK Shows Which Country Is The Nearest Neighbour

    Map of the United Kingdom and Ireland showing regions colored based on languages from Simon Shows You Maps data.

    Simon shows you maps Report

    #59

    Time To Enrage Most Of Europe With A Single Map?

    Map showing main European regions with cultural proximities and state borders highlighted, featuring Northern, Central, and Southern Europe.

    Simon shows you maps Report

    Verena
    Community Member
    4 months ago Created by potrace 1.15, written by Peter Selinger 2001-2017

    Living in Germany and the Netherlands and staying frequently in France and Scandinavia, I would say that the Dutch are closer to the Germans than French. I worked in many countries, including Poland and Turkey. Both countries share a lot of similarities in social aspects

    View more comments
    ADVERTISEMENT
    See Also on Bored Panda
    #60

    Map of Italian Motor Valley highlighting Ferrari, Lamborghini, Maserati, and other automotive brands with racing and bike OEM locations.

    Just after you cross the Alps (🚗🚴🐘) into Italy, you enter the Italian Motor Valley. The funnest and fastest Italian engineering marvels are friendly neighbours here.

    Simon shows you maps Report

    Pernille
    Community Member
    4 months ago Created by potrace 1.15, written by Peter Selinger 2001-2017

    And the food there is great too. If you like cars and good food, plan a holiday in Modena. A lovely city, and there a busses to a lot of the towns around there.

    #61

    Good To See The French Still Being Skinny

    Infographic showing adult obesity rates in high-income countries, highlighting the most and least obese nations in a clear data map.

    Simon shows you maps Report

    Marc
    Community Member
    4 months ago Created by potrace 1.15, written by Peter Selinger 2001-2017

    Map is missing Pacific nations on the left. Tonga and Nauru are the most overweight nations at 70% and 63%.

    View more comments
    ADVERTISEMENT
    See Also on Bored Panda
    #62

    The China–north Korea–russia Tripoint Must Be One Of The Weirder Borders Out There

    Map showing North Korea, Russia, and China border tri-point with ports and geographic details in a cool infographic style.

    Simon shows you maps Report

    Verena
    Community Member
    4 months ago Created by potrace 1.15, written by Peter Selinger 2001-2017

    It looks even weirder on a satellite image. Zoom in.

    View more comments
    ADVERTISEMENT
    See Also on Bored Panda
    #63

    Chart showing excess mortality rates in European countries during COVID-19, highlighting yearly data points from 2020 to 2022.

    Excess mortality in the EU during the Covid years was 12 per cent. This means we've seen 12 per cent more deaths than we would've statistically expected. The Swedish approach wasn't as lackadaisical as we make it out to be. Targeted protection of the elderly saw super high compliance. Sweden's Covid approach remains highly respected

    Simon shows you maps Report

    Cora C
    Community Member
    4 months ago (edited) Created by potrace 1.15, written by Peter Selinger 2001-2017

    As a GP, I saw a lot of "collateral damage" first hand. Investigations that were not "urgent" got rescheduled which led to late diagnosis and treatment. Well-intended people did not want to overload the system and chose not to go to ER.

    View more comments
    #64

    Michigander Remains The Funniest Us Demonym

    Map of United States demonyms by state with suffixes highlighting common regional naming patterns.

    Simon shows you maps Report

    rustyscate
    Community Member
    Premium
    4 months ago (edited) Created by potrace 1.15, written by Peter Selinger 2001-2017

    It’s massholes not massachusettsan

    View more comments
    #65

    The Electric Car Boom Continues To Boom

    Graph showing electric vehicle sales as percentage of car sales in world, China, Europe, and US from 2010 to 2023 maps data infographic.

    Simon shows you maps Report

    A.J.
    Community Member
    4 months ago Created by potrace 1.15, written by Peter Selinger 2001-2017

    Data from China are doubtful at best

    View more comments
    ADVERTISEMENT
    ADVERTISEMENT
    #66

    Enjoy Your Summer Holidays My Dear European Friends!

    Work absence by country shown in a heatmap-style infographic illustrating summer holiday trends in Simon Shows You Maps data.

    Simon shows you maps Report

    WindySwede
    Community Member
    4 months ago Created by potrace 1.15, written by Peter Selinger 2001-2017

    Sweden didn't answer, they were on holiday... 😏

    View more comments
    #67

    World map showing where Spanish-style bullfighting is still practiced, banned, or not historically practiced.

    Simon shows you maps Report

    troufaki13
    Community Member
    4 months ago Created by potrace 1.15, written by Peter Selinger 2001-2017

    In Minoan Crete they had games called tavrokathapsia (ταυροκαθάψια) that involved bulls. Tavros=bull

    View more comments
    #68

    London Continues Turning Itself Into A Bicycle City!

    Line graph from Simon Shows You Maps showing City of London transport volume decline in motor vehicles and rise in bicycles from 1999 to 2024.

    Simon shows you maps Report

    Wild Cream
    Community Member
    4 months ago Created by potrace 1.15, written by Peter Selinger 2001-2017

    I wish more cities were cyclist-friendly

    #69

    It’s Getting Warmer In Europe. In Case You Want To Travel Through Germany, This Map Might Be Of Use

    Map showing German wine regions with color-coded areas and major cities for Simon Shows You Maps SEO keyword.

    Simon shows you maps Report

    Jesse
    Community Member
    4 months ago Created by potrace 1.15, written by Peter Selinger 2001-2017

    Yellow is Franconia. With a R. And the city is Würzburg, learn to spell.

    View more comments
    ADVERTISEMENT
    ADVERTISEMENT
    #70

    Country Lookalikes

    Map showing countries with similar shapes, highlighting pairs like Venezuela and Lithuania, Algeria and Iraq, for Simon Shows You Maps.

    Simon shows you maps Report

    #71

    You Are Not Nostalgic About The 90s, 80s, Or 70s. You Are Nostalgic About Your Own Youth - Whenever That Was

    Line graph showing nostalgia peaks by age for categories like the best movies, music, fashion, and sporting events in data maps.

    Simon shows you maps Report

    #73

    Line graphs showing the ideology gap between young men and women in South Korea, US, Germany, and UK from 1980 to 2020.

    The wider the gap, the harder to find a partner. This should in turn further drive down birth rates. On top of this, the UK now has a reverse gender pay gap for young workers. Considering that women still prefer an equally or higher earning partner, birth rates should take yet another hit

    Simon shows you maps Report

    ADVERTISEMENT
    ADVERTISEMENT
    #74

    Share Of European Countries’ Population Living In The Capital City. Rome And Berlin Are Relatively Small Within Their Country - At Least When Compared To London, Paris, And Madrid

    Map showing percentage of people living in metro areas of European capitals, featuring colorful data visualization and key statistics.

    Simon shows you maps Report

    cugel.
    Community Member
    4 months ago Created by potrace 1.15, written by Peter Selinger 2001-2017

    1.8% here in Oz, of which I am one.

    #76

    Bar chart showing countries with the highest percentage of seniors aged 65 and older in 2025 with population data.

    With Italy and Japan we have two big economies where over a quarter of the population is aged 65+. Traditional models of aged care and state guaranteed retirement funding are about to collapse. Time to figure out new models. Younger nations have time and can copy successful approaches of the old nations (and dearly hope that they come up with something smart fast).

    Simon shows you maps Report

    SchadenFreudian Psychology
    Community Member
    4 months ago Created by potrace 1.15, written by Peter Selinger 2001-2017

    Let immigrants in. And/or make it easier for people to have children. Up to you. 🤷🏻‍♀️ You’re going to have to do one or the other, if you don’t like the current situation.

    ADVERTISEMENT
    #77

    Map of Europe showing different types of forestry including unmanaged forest and intensive forestry zones.

    This map categorizes European forests according to their use. Unmanaged forests are super rare. Finland and Sweden are timber plantations. France has created Landes de Gascogne, a match box forest on the Atlantic coast. Britain got rid of their forests altogether.

    Simon shows you maps Report

    ADVERTISEMENT
    #78

    Barrel charts showing Iran's monthly oil exports in 2017 and 2025 with China buying most of the oil - Simon Shows You Maps.

    Simon shows you maps Report

    Michael Largey
    Community Member
    4 months ago Created by potrace 1.15, written by Peter Selinger 2001-2017

    This is more about the embargo of Iran over nuclear weapons than the international oil market.

    #79

    This Map Might Be Bananas But The Word Keeps Changing More Than I Would’ve Expected

    Map of Latin America showing regional Spanish words for banana with colorful country labels and a peeled banana illustration.

    Simon shows you maps Report

    XenoMurph
    Community Member
    4 months ago Created by potrace 1.15, written by Peter Selinger 2001-2017

    My banana is mimimo no matter which country I'm in.

    View more comments
    #80

    Across Most Of The World, The Us Is Now Seen Less Favorably Than Just A Year Ago. The Exceptions Are Worth Noting: Israel, India, Nigeria, South Africa, And Turkey

    Chart showing the decline in favorable views of the US globally from 2024 to 2025 by country, Simon Shows You Maps.

    Simon shows you maps Report

    michael Chock
    Community Member
    4 months ago (edited) Created by potrace 1.15, written by Peter Selinger 2001-2017

    Of course the seedy underbelly of Nigeria would love the increasing amount of easily brainwashed people in the US.

    View more comments
    ADVERTISEMENT
    #81

    Graph showing popular baby names by decade with colorful trends for boys and girls, from Simon Shows You Maps data.

    This chart shows what baby names peaked in each decade in the US. The postwar Larry boom is long gone, the Jennifer-hype of the 70s and 80s died down, but Oliver is still on the rise

    Simon shows you maps Report

    Lady Eowyn
    Community Member
    4 months ago Created by potrace 1.15, written by Peter Selinger 2001-2017

    When Deborah peaked as a name it was spelled properly as Deborah. Debra is a far more modern version.

    View more comments
    ADVERTISEMENT
    #82

    Chart comparing minimum wage vs productivity and Leonardo DiCaprio’s age alongside his girlfriends’, shown in an infographic style.

    Simon shows you maps Report

    Wild Cream
    Community Member
    4 months ago Created by potrace 1.15, written by Peter Selinger 2001-2017

    Assuming this is US data. It’s so sad. Can you imagine making $7 an hour today? I make $25/hr and I’m a low-level employee haha

    View more comments
    #83

    Bar chart showing the world's most educated countries by number and share of people with a bachelor's degree or higher.

    Share of the working age (25-64) population that holds at least a bachelor’s degree by country. In the 40% hold academic credentials. Super high considering the population size of the US and the extreme debt that people go into for degrees.

    Simon shows you maps Report

    ADVERTISEMENT
    #84

    Infographic showing small countries by population with flags, highlighting Simon Shows You Maps data and country sizes under 10 million.

    16 countries are home to over 100 million people. 51% of countries officially recognized by the UN are smaller than 10 million residents. 36 countries are smaller than 1 million people.

    Simon shows you maps Report

    Kim Kermes
    Community Member
    4 months ago Created by potrace 1.15, written by Peter Selinger 2001-2017

    San Bernardino County, the largest in area in the US, is also larger in area than a number of countries.

    View more comments
    #85

    Line graph showing global life expectancy increasing from 30 years in 1770 to over 70 years in 2019, data infographic.

    Sure, big parts of our healthcare systems are in need of reform but please keep in mind what wonderful progress medicine and pharmaceuticals have given humanity as a whole in the last 100-150 years.

    Simon shows you maps Report

    michael Chock
    Community Member
    4 months ago Created by potrace 1.15, written by Peter Selinger 2001-2017

    This is very misleading. The infant mortality rate was AWFUL and has significantly improved with vaccinations, public health education and safety standards. If you only graph mortality of people over 10 years old (or even 5). The graph is much flatter, and in some regions it has dropped.

    View more comments
    ADVERTISEMENT
    #86

    Map of the Democratic mayoral primary in New York City showing voting data with candidate support by borough.

    By now you would've read how New York City voted. Have you seen the clear geographic division of votes yet? Countless cities around the world are evenly geographically divided in their political leanings.

    Simon shows you maps Report

    ADVERTISEMENT
    #87

    Beer Types By Bitterness And Alcohol Levels

    Infographic showing beer styles with alcohol percentage and bitterness (IBU) data from 60,000 recipes in cool maps format.

    Simon shows you maps Report

    #88

    Poland-Czechoslovakia Needed A Cooler Name. Just Sayin’…

    Map showing proposed unions in Europe including Benelux, Franco-British, Poland-Czechoslovakia, and Balkan Federation.

    Simon shows you maps Report

    Tim Gibbs
    Community Member
    4 months ago Created by potrace 1.15, written by Peter Selinger 2001-2017

    I agree Britain should run France! 🤣

    View more comments
    #89

    This Map Shows The Radioactive Fallout In The Us From Nuclear Testing. The First Test, Trinity, In New Mexico Is Visible

    Heat map of deposition density across the United States showing varied intensities in a detailed data visualization map.

    Simon shows you maps Report

    Ace
    Community Member
    4 months ago Created by potrace 1.15, written by Peter Selinger 2001-2017

    Slightly misleading, as background radiation is relatively much higher in some places, hence the slight purple dips in Florida and the mid-west, which are not really a result of nuclear weapons testing,

    ADVERTISEMENT
    #90

    I Guess It’s Truly The Heartland Of The Us?!

    Map highlighting Nebraska as water and landlocked, showing access and landlocked states across North America.

    Simon shows you maps Report

    Kyle Simonson
    Community Member
    4 months ago Created by potrace 1.15, written by Peter Selinger 2001-2017

    Some really bad AI made this map or someone who can't read a map. Wisconsin, Illinois And Indiana all have shores on a Great Lake, Wisconsin on two Great Lakes.

    View more comments
    ADVERTISEMENT
    #91

    This Map Shows When (If Ever) Asian Nations Partook At The Fifa Football World Cup

    Map showing the last year Asian countries played in the World Cup with highlighted countries and years on the map.

    Simon shows you maps Report

    Judes
    Community Member
    4 months ago Created by potrace 1.15, written by Peter Selinger 2001-2017

    For World Cup purposes, Australia is in Asia (since about 2002).

    View more comments
    #92

    Color-coded map of Europe displaying the Human Development Index per 1,000km² using detailed data visualization.

    Wonderfully detailed map shows the Human Development Index across Europe. Concentration of development in Central Europe generally and within the big cities within each individual country

    Simon shows you maps Report

    #93

    Minor Correction: Skateboarding Seniors Are Cool As Heck And The Chart Should Point Up Again!

    Graph from Simon Shows You Maps illustrating how coolness of activities changes with age, including skateboarding and complaining.

    Simon shows you maps Report

    Wild Cream
    Community Member
    4 months ago Created by potrace 1.15, written by Peter Selinger 2001-2017

    Oh I remember Juul 😂 I had like 20 lying around my house and “where’s my juul” was my theme song. I can’t believe that was only like 5 years ago, does Juul even exist anymore?

    ADVERTISEMENT
    #94

    Chinese Factories Would Get To Sell Heaps More American Flags Once The Us Take In Another State Or One State Defects

    Evolution of the United States flag from 1775 to 1960 shown with map-style infographic and data points.

    Simon shows you maps Report

    Fat Harry (Oi / You)
    Community Member
    4 months ago Created by potrace 1.15, written by Peter Selinger 2001-2017

    They're lucky to have a nice round number of states now, because some of those early ones with weird numbers look ugly as sin. Also, why did they not do three rows of seven for 21 stars?!

    View more comments
    ADVERTISEMENT