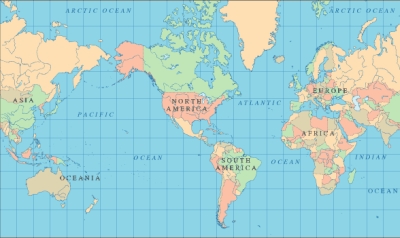
Ever wondered why Greenland looks as big as Africa on the map? It’s because of something called the Mercator projection. Putting a 3-D planet on a two-dimensional world map was challenging for early cartographers. So, a Flemish geographer and cartographer named Gerardus Mercator came up with a solution for the most accurate world map.
In 1569, he designed an atlas that could be accurately used for navigation. Still, the downside was that his system distorted the size of objects depending on their position relative to the equator.
Because of this, landmasses like Antarctica and Greenland appear much bigger than they are. Though there are around 40 types of map projections, from conical to polyhedral and retroazimuthal, depicting the actual size of the world, this one is still used the most because of its convenience and simplicity, even by Google Maps. None of these projections can be titled the real world map because they all depict the same Earth through a different lens.
So, what does the real-world map look like? To show how incorrect our understanding of countries by size is, a website called thetruesize.com lets you move land masses into different locations. This helps you understand the actual size of countries.
We at Bored Panda played a bit with this tool, and what we found will change your perspective on our planet’s geography. The website lets you juxtapose two countries to compare their relative size, and if you’re wondering which countries are the best to live in, we explored that too.
Here’s what the real size of countries looks like.
This post may include affiliate links.
US Moved Down Next To Australia Looks Unbelievably Small
Size of contiguous United States Not counting Alaska & Hawaii, the 48 contiguous states occupy a combined area of 3.12 million sq. mi. While Australia is 2.99 million sq miles - I never realized they were so close in size!
There's a lot of empty space in the middle. Most of us live along the coast or within a few hundred kilometers of it.
Load More Replies...Actually, Australia is incredibly large and thinly populated. 33 people per km² compares to 3,1....i.e. the US is ten times more densely populated (fun fact: central european states such as the netherlands are ten times more densely populated than the US...)
The UK is about a 40th of the size of the US, but the US only has 5X the number of people. The UK is dense!
Load More Replies...No big surprise. If anything, Australia looks smaller; it is, after all, a continent.
Russia On The Equator Is Not A Giant Bear Anymore
When you look at the globe, things are nearer or farther from your eyes. If you simply take the surface off of the globe and stretch it on a table, part of the material will shrink and it'll be a weird shape that's hard to interpret (called a Boggs eumorphic). To control for this, people invented projections, the most famous being the Mercator projection, which is called a conformal projection because it keeps countries the same shape (conformal = same form). The idea is to have accurate angles in a rectangular shaped map. To keep the angles equal as you project the surface of the sphere on a rectangle, you need to multiply the distances by a factor that is bigger the farther you go from the equator. In fact, the last point, 90º from the equator, is multiplied by infinity. (Of course, points are 0-dimensional, so multiplying them by infinity doesn't actually make an infinite map.) That makes things far from the equator look bigger. This goes both ways, so, if you make a rectangular projection that is area-accurate, then it it's no longer conformal: which means the shape changes. That's what happened here.
Load More Replies...But...Russia it's just a country.... Africa, a continent... Not a country.
empty country (140 mln ppl and snow, snow, ice)
Load More Replies...still stupid, if the land masses are on the same map, the someone is blowing up or shrinking the mask, Russia's mask would cover most of Africa, Iran, India... the Philippines and people fall for this BS?!?!? come on people. common sense is in play.
the Mercator projection distorts the size of objects as the latitude increases from the Equator to the poles, where the scale becomes infinite. So, for example, landmasses such as Greenland and Antarctica appear much larger than they actually are relative to land masses near the equator, such as Central Africa.
Load More Replies...Russia is 10,000 km wide. So this new map says Africa is also 10,000 km wide? NOPE.
Africa is much larger than many expect... i.e., from Dakar to Mogadishu is 9500km
Load More Replies...Russia is approx. 6000 miles wide. Africa is approx. 4600 miles wide at its widest point. This something wrong here.
This is incorrect. Russia's maximum is about 5600 miles and africa's maximum is about 5000.
Load More Replies...B******t, it takes 13 hours non stop to fly east to west across Russia. How long to fly across Africa? Few hours at most..
shortest route by flight will take you almost 12 hours from Dakar to Mogadishu... Africa is much larger than most people realize.
Load More Replies...If Romania Was An Island In The Arctic Ocean
I don't get why the map was done so inaccuratelly? can somone explain?
For better navigation the globe was projected on a grid of perpendicular parallels and meridians. But since the real area between two meridians is decreasing near the poles, the projection is distorted, because on the map the distances are equal.
Load More Replies...this is the stupidest way of representing and explaining we look at 2D maps of a sphere and therefore there is distortion.
Australia Is Way Bigger Than You May Think - It Covers Almost The Whole Of Europe
We do not have kangaroos and koala beers over here, though. :( (And, well, also no giant spiders.)
It's just a koala. Koala's are not bears. We do have beers down under though. Aussies love a beer!
Load More Replies...Not being mean or anything but "koala beers" literally made laugh out loud :D
Yes, it's a continent, as is Europe. Why would anyone be surprised at this?
There is always a compression factor that will need to be considered on maps. Maps are accurate over the equator and the scale is expanded closer to poles
Giant spiders? Lived here 38 yeah and I never knew we have giant spiders or bears
Is Africa Bigger Than it Appears on the Map?
Yes, Africa is significantly larger than it appears on many traditional maps. An interesting fact about the Mercator projection is that it distorts the sizes of landmasses as they get farther from the equator. This distortion disproportionately enlarges countries near the poles while diminishing the size of equatorial regions. As a result, Africa, which straddles the equator, is typically misrepresented as much smaller than it is in reality.
In reality, Africa covers an expansive area of about 11.7 million square miles. Its vastness is often underestimated on conventional maps, leading to misconceptions about its size and significance. On an accurate world map, Africa would appear three times the size of US.
If Brazil Was In Asia It Would Be Massive
The map of the earth is a 2 d representation of a 3 d object, that's why the size is different, because the map is distorted.
Brazil is massive no matter where you put it (I am from Venezuela.)
Load More Replies...Google says Brazil is 8.5 million sq km and China is 9.6 million sq km. The image above shows Brazil twice as big as China. Can you please explain?
It's not about how big they are it's about how big they seem to be on different places on the map. The fact is Brazil is still the same size whether it was in Europe, Asia, Australia, North or South America or anywhere else in the world but the map will show it differently based on it's distance from the equator (on the map).
Load More Replies...Ummmm.... Brazil is smaller than China. So if Brazil was in Asia, it still would be smaller than China
They put Brazil over Russia, that is why it looks bigger than China. The same article shows China over Russia and it looks massive in the same position as well.
Load More Replies...If Madonna was a man she would have had a mustache :P For people who does not understand this :) Complete BS
Brazil is big it is near the equator on a globe same as africa . Greenland looks big because it is at the top of the globe it was drawn to scale to a flat map. But in reality it is small. Why is it that it is actually smaller in size. Well I guess the logical answer is that the world is flat if it wasnt why the big difference in greenland
Load More Replies...No, it would be the same size as it is now. Your perception of it would be different; that's all.
Meridians converge from 111km apart at the equator to a point at the poles
Indonesia Would Spread Almost Across The Whole Of Russia
Don't you understand it's the projection not the real country size? Go learn more, don't be a stupid jackass
Load More Replies...I have that feeling every time i fly to Indonesia...it's big, much bigger than one would have thought...not just a bit away from Singapore but quite a long way
maybe thats explain why we have slow internet connection in indonesia
Indonesia only extends 3200 miles east to west, Russia is almost 6000 miles across....wrong again.
3200ish miles east west to 5600 miles east west, and those 1400 miles are plainly seen on the map. Use your eyes.
Load More Replies...That explains how over 300 million Indonesians can fit on those islands.
Greenland Is Not So Big When Compared To USA And Brazil
so everything to the north is being stretched and as you get close to the equator it becomes more actual size?
I prefer to tust my globe ;) AtlantisEd...9ce347.jpg
It's because they are doing it on the Mercator projection, which is what most maps online are made with. The Mercator projection greatly distorts space the farther away from the equator things get. Things bear the equator are more proportion in size. This entire article is honestly horrendously misrepresenting geographies because they didn't explain the concept of the projections. Look at a Robinson projection, and *most* of the map with be shown somewhat equal representation, but the outer areas will be more squished/distorted And then, many other projections show many other representations of the earth. Basically, any flat map with be distorted because each different projections is calculated a different way to show different areas of the world with more/less/distortions. They all serve different purposes
I always thought Greenland looked huge on the map! So big I couldn't get my head around it, this puts things into a better perspective
When You Move Canada To South America
Nope. The width of South America at its widest point is 2,705 miles (4,353 km), The width of Canada at its widest point is 5,780 miles (9,306 km).
They changed the angle of the position.
Load More Replies...I wonder how dumb it's possible to be. People, the images do not show actual size of the countries or even relative scale, that's the point here. The images are designed to show how inaccurate the mercator projection is. In other words, following the scales used in the mercator projection this is what Canada would look like on map were it in South America
I wonder the same thing, the tool they are using to show the inaccuracies in the projections is not accurate in itself. If Canada and South America were shown on the same spot of the map they would be distorted by the same amount and Canada would still appear bigger. So in simpler terms this map *doesn't* correctly show what Canada would like on the map were it in South America as they have made errors when scaling.
Load More Replies...This excellent post only explain with very nice and interesting tools the distorted representation of the world we are used to see. I really cant understand why people can doubt about a fact, even if it has just been explained above, even when someone bothered to develop a site that lets you experience it. Why don’t they just google the surface of the countries? It would avoid them to let us know how limited their reasoning skills are. Very nice post! Good work!
It's not about how big the countries are bits about how they would be drawn on the map if you change the location. The actual size doesn't change.
FOR INSTANCE, Go to GOOGLE EARTH Here https://earth.google.com/web/@55.27343384,-79.31232171,-1514.55079955a,13235866.6003418d,35y,2.32795367h,0t,0r and you will see Not Only the SIZE of Greenland is Different, but ALSO the Angle We Perceive it to Be on the Current Distorted Map, Get it?
Canada is the 2nd biggest country in the world after Russia based on size in square miles. Russia is by far the biggest country in the world.
Canada is massive and it's still the second largest country in the world behind only Russia.
What is the Most Realistic World Map?
The AuthaGraph is considered to be the real world map that shows the true size of countries.
Unlike the Mercator projection, which distorts the sizes of landmasses, the AuthaGraph projection aims to maintain equal area property. This means that the relative size of continents and countries is preserved accurately. This is essential for understanding the true proportions of different regions of the world.
The AuthaGraph projection minimizes distortion by dividing the Earth’s surface into 96 regions, which are then transferred to a tetrahedron. This tetrahedron is unfolded and flattened to create a two-dimensional map.
While no projection can be perfect in preserving both area and shape, the AuthaGraph projection comes really close to showing the real size of countries.
California Moved Onto The UK Shows They're Quite Similar In Size
california is 420,000 sqkm. great britain is 293,000 sqkm (including ireland). therefore, no.
China Placed On Top Of Russia
It's just how they would look on a map due to the Mecator projection explained above... Too difficult to read or what?
Load More Replies...Except Russia is litterally twice the size of China. That is why we measure landmass area and don't look at 3D spherical projections on a 2D rectangle.
It all has to do with putting a round object onto a flat, rectangular presentation. Locations near the poles get stretched and distorted, appearing much larger. The point of the map is that IF China was in that particular geographic location (in the same spot as Russia), it would look much larger when transcribed onto a flat map.
Australia Moved Onto North America Becomes REALLY Big
In the first picture australia is on usa, in this it is on canada. Canada is to the north from usa therefore australia looks bigger. Move it towards the equator and it will get smaller
Load More Replies...No. For example, it takes 1 day and 16 hours to drive from Sydney to Perth in Australia traveling 3937 km. Compare that to 2 days and 11 hours driving from Vancouver to Peggy's Cove in Canada which is 5868 km. I agree with some things on here, but having lived for decades in both countries, I'm sorry this is not accurate.
I'm disturbed. My folks and I drove 8-9 hours from Adelaide to Melbourne, but if we were American we would've driven through like 4-5 states maybe? I always wondered how Americans seemed to cross through so many states in a road trip movie. I can't imagine that they're that small.
This one is intentionally misleading, considering, you can put it closer to the equator in north america. That is the Arctic.
Canada is 5780 miles east to west, Australia is only 2485.....oops wrong again. They need a NG education.
All of this isn't completely true. Australia has a square milage of 2.97, while the us has a square milage of 3.797. This china russia one is weird two. chine has around half the square milage of russia
NO....it stays the same size. Again, it's a perception issue with a simple projection map.
actually, australia would be almost a giant anywhere in the world except there where it is *_*
No, there are 5 counties larger than Australia. No matter where you move it, it isn't in the top 5 for largest nations. They just have an over-inflated sense of importance.
Load More Replies...Japan Can Stretch Almost Across Canada
It all has to do with putting a round object onto a flat, rectangular presentation. Locations near the poles get stretched and distorted, appearing much larger. The point of the map is that IF Japan was in that particular geographic location (closer to the North Pole), it would look much larger when transcribed onto a flat map.
naw,...the heat just shrinks things, that's all. have you ever put a wool sweater in the dryer?
Load More Replies...Gordon, you're probably right but the difference between these 2 countries is very, very big. I don't think this is proportional to surface area.
I don't think Japan's 1870 mile length is any comparison to Canada's 5780 miles.
Yeah that’s probably why the length of Japan isn’t placed across the width of Canada lol Use ur 👀
Load More Replies...Why is Greenland So Big on the Map?
Greenland appears disproportionately large on the maps due to an inherent distortion in translating the Earth’s three-dimensional, spherical surface onto a two-dimensional map.
The Mercator projection is widely used for navigational purposes because it preserves angles and, therefore, helps sailors navigate straight lines or constant compass headings. However, it doesn’t preserve area or size accurately, particularly as you move away from the equator.
It exaggerates the sizes of landmasses as they approach the poles, causing polar regions to appear much larger than they are in reality.
Greenland is situated near the North Pole, and as a result, it is significantly distorted on Mercator maps. In reality, Greenland is much smaller than it appears on traditional maps. It covers an area of approximately 850,000 square miles, making it only slightly larger than Saudi Arabia (830,000 square miles).
Antarctica Is Not So Much Larger Than Brazil
Well, I'm not a fan of global warming, but there is land under Antartica, so it's not gonna disappear
Load More Replies...Actually, Brazil is 8,5 mil. square km and Antarctica is 14 mil. square km, so Antarctica is WAY bigger...!
These maps are about the most pointless thing I've seen online in 2020
Antarctica at 5.405 million mi² is just about 5/3rds the size of Brazil at 3.288 million mi², which means you would need to add the area of Argentina twice to Brazil to make up the area. your approximations include way to much rounding.
It all has to do with putting a round object onto a flat, rectangular presentation. Locations near the poles get stretched and distorted, appearing much larger. The point of the map is that IF Antarctica was in that particular geographic location (closer to the Equator,) it would look similar in size to Brazil when transcribed onto a flat map.
Brazil: 8.5 million square kilometers, Antarctica: 14 million square kilometers.... these pictures starting to make less and less sense...
This Is How India Changes As You Move It North
Wholly Molley! No wonder I get so many customer service agents in India.... that is one HUGE country.
Yea. Customer service agents , sure. We have a couple of dudes who are the CEOs of GOOGLE and MICROSOFT too .
Load More Replies...Ridiculous. POK is part of India. How dare you show it as part of Pakistan ( Bloody Terrorist Country)
wow that's a huge difference. But Kashmir is bigger. This is a rough idea I guess.
You didn't show Pakistan occupied Kashmir and China occupied part of Kashmir in India's map
It's because they are doing it on the Mercator projection, which is what most maps online are made with. The Mercator projection greatly distorts space the farther away from the equator things get. Things bear the equator are more proportion in size. This entire article is honestly horrendously misrepresenting geographies because they didn't explain the concept of the projections. Look at a Robinson projection, and *most* of the map with be shown somewhat equal representation, but the outer areas will be more squished/distorted And then, many other projections show many other representations of the earth. Basically, any flat map with be distorted because each different projections is calculated a different way to show different areas of the world with more/less/distortions. They all serve different purposes
Canada Moved Down Onto The US Reveals That Both Countries Are Pretty Much The Same Size
but 2/3rds of Canada is uninhabitable because it's in the f-ing article circle.
But almost all of the USA is unihabitable because of the f-ing Americans...
Load More Replies...This one is actually accurate when backed up by figures. Canada being 9,984,670 sq km and the U.S. being 9,826,630 sq km.
Except without Alaska, the contiguous 48 are only 8,080,464 sq km. So Alaska makes up almost 20% of the USA's area
Load More Replies...Except Quebec is not covered in ocean and you have the upper half of Canada transposed over Canada.
the true way to compare the size diferences of countries is look them at a globe map. There, in a globe, you don´t have mercator projection.
Funny this should be mentioned; Look at the actual map of the world: https://www.digitalcommonwealth.org/search/commonwealth:7h149v85z Look at the size of Australia in comparison to other land masses. Look at where *Antarctica* is because it's not where we are generally told it is. This also happens to be the same map the U.N uses. This is the actual earth map, and surprise surprise, there is no globe. You live on a flat plane. Even the guy who creates the pictures of earth at NASA admits that beautiful ball we see in pictures, is nothing more than a picture https://www.nasa.gov/centers/goddard/about/people/RSimmon.html His very words on the NASA website: "Then we wrapped the flat map around a ball. My part was integrating the surface, clouds, and oceans to match people’s expectations of how Earth looks from space" There you go folks
You ignore what he mentions earlier in the same paragraph - "a photograph from above low Earth orbit that showed an entire hemisphere (one side of a globe)"
Load More Replies...Wow people get so much at arms with each other over a simple debate. If we are all in Soo much disagreement with each other as we are over simple problems like this it's no wonder we aren't solving bigger problems like hunger and war, or world industrial take over. We are doomed at this rate. If we all have such a vague understanding of these things, the questions we should REALLY start asking is what are we letting our governments teach in our schools, and why are we Soo willing to be mislead and I'll- informed Some of this stuff about maps is interesting. I learned about the proportional indifferences of the mapped lands masses only a few years ago and went..." Huh I didn't know that" , then carried on with my day. We as a people need to realize that no matter how impartial one wants to remain, the history books will all ways be written with some bias. We need to beware that with said biases, comes perspective. That perspective is usually from that of the winning side.
Because of this one sided perspective It would be nearly impossible to write the history books without the facts becoming propagandized and skewed. I have also read that the currently accepted maps we use are also a slight representation of the current geo-political paradigm, giving greater/ lesser importance to countries by misrepresenting land masses. The source I read from noted that the G8 countries were of the greater mis proportion. Of coarse that part could be coincidental. until I hear otherwise I remain open to the truth, even in the event that it contradicts what I thought I once knew. That's means also, being prepared to learn I could be wrong in my beliefs. Be nice to each other guys. And know that if you find out one day you were wrong, be okay with that we are not perfect. Also, if you find out one day your right, go easy on your fellow man, we're not perfect.
Load More Replies...Ok, so I no longer trust a single picture in this article after this one. Now Canada is similar to the USA, when the first picture shows the USA being about the same as Australia, and another picture shows Australia as quite a bit smaller than Canada. Calling BS on this whole thing. Too much contradiction.
Its because Alaska represents almost 20% of the area of USA but it isn't factored into the visual comparison with Australia.
Load More Replies...Man...this is confusing. How does 4400 miles become smaller than 3300 miles? No matter how hard I try... I can't figure out how Canada becomes smaller than the USA.
Statistics that indicate that China and the USA are bigger than Canada are based on land area excluding the surface area of freshwater lakes. When calculated that way, Canada becomes fourth. When freshwater surface area is included, Canada is second.
Load More Replies...All you have to do is look at the sq km by country...none of this adds up
Yeah, except for Nunavut and the Northwest Territories, which on their own are three times the size of Continental Europe.
How This All Works
You should move this to the top for the dimwits. This is a great series of posts. Thanks for sharing - fun stuff :D
Second that. Confidently wrong littered everywhere.
Load More Replies...So it seems Africa is even more massive than it appears on a map. I'd like to see how the continent would look if place as north as Canada.
No Africa is the most accurately drawn on maps. If you compare the size of Africa on the sphere and the map it will stay the same
Load More Replies...North America is almost 1/3 larger than South America by area and length wise about 1000 miles larger
Load More Replies...Is the True Size Map Accurate?
The True Size Of… is an interactive tool that lets you visually compare landmass. It provides a more accurate representation of landmass sizes and minimizes distortion.
USA Compared To Europe
Why does it get bigger if moved somewhere else where it is not actually there
If Poland Was An Island In The Norwegian Sea
The US Could Easily Cover The Whole Of Canada But It Becomes Much Smaller When It's Moved South
Ask 100 people in a shopping male whether they believe this is the work of rogue regimes...90 will say "yes".
How do you fit 100 people in a male, while they are shopping?🤷🏽♂️ /s
Load More Replies...Just google for Mercator projection. This is basic geography.
Load More Replies...When You Move Mexico Onto Greenland Its Size Increases Dramatically
If Lithuania Was An Island In The Barents Sea And Artic Ocean
Moving UK North And South Reveals How It Actually Compares To Other Countries
well the UK is the UK, the EU and the UK where always something separate and different
Load More Replies...Democratic Republic Of The Congo When You Move It North
Because it's been rapped and robbed from all the other countries and then care nothing about the people.
Load More Replies...How The Size Of Russia Changes As You Move It South
Yeah, but earth is a sphere. And it’s impossible to have a map 100% like this, so it’s pretty much true that Russia is the 3rd largest country.
I think that's because time zones are not only determined by geography but also by other factors, to make it more useful. The pulation in (central) Australia is very thin, so who would benefit from the people that do live thete using different time zones? China covers five geographical time zones but uses just one, to increase economic efficiency.
#27 Tiny Iceland Compared To New York
Tiny Iceland Compared To Its Giant Neighbor Greenland
Let Me Just Make This Easy; The Issue Is Peters (accurate) Vs Mercator (inaccurate).
"Peters" (actually Gall-Peters, as Gall came up with the projection long before) is no truer than Mercator overall. The key phrase here is area: Gall-Peters is designed to preserve relative areas, while Mercator preserves direction and shape. "True representation of land area" and "Incorrect/false representation of land area" are not entirely false statements, but they are too easily read as "Gall-Peters good, Mercator bad!" Which is simply not the case. But despite the famous West Wing scene, in fact there are many better projections than Gall-Peters for showing the whole world — and they have been and continue to be in use in most major publications related to maps and geography for many, many years. There's no single most popular projection, but Mollweide, Winkel Tripel, and perhaps Robinson remain some of the most common. In short: each projection has its own uses, and its own shortcomings. Mercator was never meant to be the only projection ever used.
Love seeing someone so confidently right as opposed to dozens of people who are so confidently wrong everywhere in this thread.
Load More Replies...There is one that actually gives both correct size and shape. You may have heard of it. It's called a globe.
Both are inaccurate, this is the most accurate one, but it doesn't use the rectangular paper: map_goode.png
Can we use a projection map other that the one Arno Peters stole? One that doesn't warp things as dramatically as the Peter's Projection does. The Mercator projection map actually serves a useful purpose by preserving the shapes of the coastlines (it's a naval map). The Peter's map is just a futile attempt at fame.
This is really interesting. And fun. It's really hard to compare countries any other way.
Europe is tiny... So so tiny... Amazing how the tiniest continent has advanced the world so much!
It's a matter of perspective the world civilization where already advanced before conquest of Europeans and their cultural imposing in others. That is why they become central
Load More Replies...White imperialist have lied to us about everything. I love all people regardless of color or creed. Africa dwarfs eruope as a whole but is shown contrarily. Im against those who lie and manipulate the minds of others. This whole site is b******t.
Alaska Doesn't Seem So Big When Compared To 48 Contiguous States
Texas is less than half the square mileage as Alaska. Are all these projections as wrong as this one??
This map does not include the islands that increase Alaska's length and width. Include them, and Alaska stretches across the entirety of the contiguous US.
No that still looks pretty big lol one state is pretty much the size of the whole west coast! Lol
Texas Moved On Top Of Alaska Shows That They're Almost The Same Size
By almost the same size do you really mean less than half as big as Alaska?
No. It demonstrates the distortion that takes place when a geographic area is moved north or south on a Mercator projection map. Neither Alaska or Texas actual areas are depicted on a Mercator map.
Load More Replies...As Alaskans are fond of saying, "You could put Texas inside Alaska and there wouldn't be a road to it." When Alaska was petitioning to become a state, Texans said it should be cut in half, so they wouldn't lose their biggest state status--but then they found out they'd be the 3rd largest state.
As a Texan - we know that most of Alaska is just ice, so if it melted, Texas would totally be larger
You Cannot Make Legitimate Size Comparison Unless You Are Doing So On An Equal Area Map
The second article discusses the inaccuracies of the Mercator projection, similar to the detailed exploration in the first article.
For a deeper look into how maps can distort perceptions of country sizes, you might explore the interesting ways countries are depicted in size.
This is widely known phenomenon: the problem with our world maps is that we try to map a round object on a flat surface. As far as I know, there is no mathematical method to map it 1:1. Because of this setup, our view on countries on world maps are distorted. Also nice fact: depending on where you buy your map, it's different everywhere, as each country places itself in the middle of the map
Fun & true fact : Canada don't place himself in the center on the map, we actually put the Atlantic Ocean/Europe in the center (like #12; #14). This way we don't hurt anyone.
Load More Replies...One thing that never amazes me is the ignorance of people. :)
Load More Replies...Too bad the countries of the African continent are so underrepresented in the compared photo's. As far as I know they represent a very big part of the world in actual size!
EXACLTY my thought. Interesting that it's the only land mass not shown.
Load More Replies...It is a funny and tragic thing at the same time that SO many people don't understand how the geographic projection works. This is elementary school knowledge people, at least where I come from - in fifth grade when children start learning geography they are taught the basics first - like shape of the Earth, the map projections, rotation and revolution of the Earth and it's consequences, etc...
Thank you Mr Mercator for giving generations a completely wrong view of the world.
I don't fully understand this. Can the publisher please explain? I get how California is about the the same size as the UK but the rest are puzzling.
Map distortions are caused by trying to project features on a sphere onto a flat surface. Globes are better for size comparisons between countries and/or continents. About the best map to view earth's features with little distorionon a flat surface is a Bucky Fuller dymaxion map.
Load More Replies...I don't get it. In #28 (Alaska next to the 48 Contiguous States) Alaska (moved South) looks like half (of 48 Contiguous States) and in #29 Texas (moved North) alone looks as the whole Alaska? It shouldn't scale with the same percentage if you move/compare to the North or South of it's original position?
Sigh .. Read about the Merc projection. But I will explain, Texas is closer to the equator so it looks smaller than it should compared to other states. So don't imagine the USA as havin'the same scale.
Load More Replies...This is widely known phenomenon: the problem with our world maps is that we try to map a round object on a flat surface. As far as I know, there is no mathematical method to map it 1:1. Because of this setup, our view on countries on world maps are distorted. Also nice fact: depending on where you buy your map, it's different everywhere, as each country places itself in the middle of the map
Fun & true fact : Canada don't place himself in the center on the map, we actually put the Atlantic Ocean/Europe in the center (like #12; #14). This way we don't hurt anyone.
Load More Replies...One thing that never amazes me is the ignorance of people. :)
Load More Replies...Too bad the countries of the African continent are so underrepresented in the compared photo's. As far as I know they represent a very big part of the world in actual size!
EXACLTY my thought. Interesting that it's the only land mass not shown.
Load More Replies...It is a funny and tragic thing at the same time that SO many people don't understand how the geographic projection works. This is elementary school knowledge people, at least where I come from - in fifth grade when children start learning geography they are taught the basics first - like shape of the Earth, the map projections, rotation and revolution of the Earth and it's consequences, etc...
Thank you Mr Mercator for giving generations a completely wrong view of the world.
I don't fully understand this. Can the publisher please explain? I get how California is about the the same size as the UK but the rest are puzzling.
Map distortions are caused by trying to project features on a sphere onto a flat surface. Globes are better for size comparisons between countries and/or continents. About the best map to view earth's features with little distorionon a flat surface is a Bucky Fuller dymaxion map.
Load More Replies...I don't get it. In #28 (Alaska next to the 48 Contiguous States) Alaska (moved South) looks like half (of 48 Contiguous States) and in #29 Texas (moved North) alone looks as the whole Alaska? It shouldn't scale with the same percentage if you move/compare to the North or South of it's original position?
Sigh .. Read about the Merc projection. But I will explain, Texas is closer to the equator so it looks smaller than it should compared to other states. So don't imagine the USA as havin'the same scale.
Load More Replies...
