ADVERTISEMENT

Most of us have a general idea of how we learn best. Some might retain information better by listening or taking notes, while others may prefer being hands-on with the topic or looking at tables and diagrams. When it comes down to it, there’s no one size fits all.

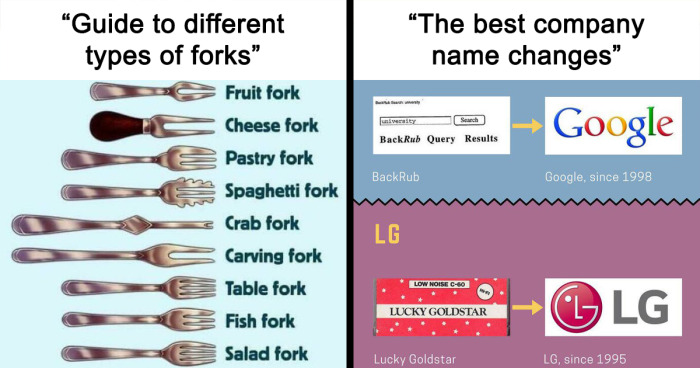
Today, visual learners are in luck because we’re looking at a subreddit called “Infographics,” a collection of data visualizations in various forms, like bar charts and heat maps. Full of colors and creative imagery, they’re both educational and fun. Scroll down to find the best ones that might change the way you see the world.

Click here & follow us for more lists, facts, and stories.

#1

Evolution Of The Alphabet

Infographic showing the evolution of the alphabet with colorful symbols and letters illustrating interesting facts about the world.

Heath-Relecovo Report

RELATED:
    #2

    The Average Cost Of Insulin By Country

    Infographic showing global insulin prices by country, highlighting cost variations in a visual infographic about world facts.

    jpc4stro Report

    #3

    Measure System In The United States And In The Rest Of The World

    Comparison of US customary units and metric units for measurement and temperature with visual infographics highlighting world facts.

    User Report

    Infographics are a creative way to display data that breaks up complex information into bite-sized pieces. For this reason, it can be a great learning tool in education.

    For one, such visualization can hold a person’s attention for longer. As people are exposed to more and more information every day, it’s hard to keep them focused and prevent them from quickly moving on to the next shiny piece of statistics.

    ADVERTISEMENT

    Just for us to imagine how distracting it can get, 2.5 quintillion bytes of data were created daily in 2021, according to The Next Tech. Therefore, infographics can help by taking an overwhelming amount of facts and presenting them with engaging images and colors.

    #4

    Best Kind Of Street Lamps

    Streetlamp light pollution levels ranging from unacceptable to best with fully shielded and motion sensor lamps shown in infographic style.

    FluxCrave Report

    #5

    The Deadliest Hunters On Land (Based On Successful [end] Percentage)

    Infographic showing the deadliest hunters on land ranked by successful k**l percentage with animal icons and a tree background.

    jpc4stro Report

    ADVERTISEMENT
    #6

    The Current Us Healthcare System vs. A Single Payer System

    Infographic explaining single payer health care system versus current system with paycheck comparisons and government role.

    Dre_wj Report

    ADVERTISEMENT

    Besides, most people process visual material much faster and tend to recall it better.

    Neuroscientists from MIT found that the brain analyzes an image in 13 milliseconds, making these visuals a great learning aid. Our mind also tends to attach emotion to pictures, which explains why the average person remembers 65% of visual information ten days later, while they can recall only 10% of something they heard ten days ago.

    Furthermore, they often prove effective in education because they use images to highlight, explain, or enhance text-based information, which also encourages data retention for many learners.

    #7

    15 Famous Cats In The History Of Mankind

    Infographic showcasing 15 famous cats with interesting facts about the world in visual infographics.

    Murmeo Report

    #8

    We Live In A World Of

    World map infographic showing roads, railroads, airports, seaports, and cities in vibrant colored lights.

    User Report

    #9

    Everything Owned By Nestle

    Infographic showing Nestlé’s ownership of brands across baby, bottled water, cereal, chocolate, coffee, dairy, drinks, food service, health, ice cream, and pet care categories.

    wrestlebuffet Report

    ADVERTISEMENT
    ADVERTISEMENT

    In addition, these visuals can be applied for a variety of uses. They are ideal for foregrounding important events in a historical period. They help us understand how certain occurrences interconnect and influence each other and how they have affected the world.

    By using infographics, number-heavy statistics can be made more interesting, and adding diagrams and short text makes them easier to process and remember.

    #10

    Guide To Different Types Of Forks

    Infographic showing different types of forks including oyster, fruit, cheese, pastry, spaghetti, and carving forks.

    _Mr_Serious Report

    #11

    Batmobile, From 1966 To 2016

    Visual infographics showcasing the evolution of Batmobile designs with detailed technical illustrations and facts.

    giuliomagnifico Report

    #12

    Highest Ocean Plastic Waste Polluters

    Aerial view of ocean plastic waste polluters visual infographic showing estimated annual plastic pollution by country.

    giuliomagnifico Report

    ADVERTISEMENT

    Teachers can also use them as assignments for homework. Giving students a long text and letting them transform it into something more appealing provides them with the opportunity to be more creative and shakes up the ordinary routine.

    While doing it, they also conduct research and try different applications of information. As a result, learners demonstrate critical thinking by filtering data, identifying patterns, and presenting carefully curated projects.

    #13

    History Of Rising Temperature

    Graph showing global temperature changes over 22,000 years with key historical events in visual infographics format.

    nkj94 Report

    ADVERTISEMENT
    #14

    Something To Consider Before Enrolling

    Bar chart infographic showing most-regretted college majors with percentages, part of interesting facts visual infographics.

    ExNihiloAdInfinitum Report

    #15

    Top 20 Major Companies In The Us With Worst Employee Retention

    Infographic showing employee tenure across major US companies as part of interesting facts about the world in visual infographics.

    User Report

    ADVERTISEMENT
    See Also on Bored Panda

    If it so happens that children are only taught through lectures or text, teachers are neglecting 65% of visual learners, and they miss the opportunity to increase retention rates, which are essential in the assessment strategies of schools.

    #16

    The Highest-Grossing Biopics Of All Time

    Bar chart infographic showing highest-grossing biopic movies and worldwide box office revenue in a visual facts format.

    giuliomagnifico Report

    #17

    The Most Popular Car Colors In The Us

    Infographic showing the most popular car colors in the U.S. in 2023 with visual facts about world trends.

    jpc4stro Report

    ADVERTISEMENT
    See Also on Bored Panda
    #18

    Coca-Cola vs. Pepsi Revenue [oc]

    Comparison infographic showing Coca-Cola and Pepsi revenue growth from 2019 to 2023 with visual data charts.

    carbon_finance Report

    ADVERTISEMENT
    See Also on Bored Panda

    Even though infographics might seem intimidating, there are plenty of tools online that can be helpful, such as Infogram, Canva, Easelly, and Edraw.

    Their designers advise having an outline before starting the creative process. Try to decide which points are essential. Then, you can move on to ensuring that the readers are guided through the visuals and that the story you’re telling is coherent and has a gradual ending.

    #19

    The World’s Top 10 Electronics Exporters

    Infographic showing top electronics exporters by country and region in 2000 and 2021 with share percentages and global trends.

    jpc4stro Report

    #20

    World Economy

    Infographic displaying world economy GDP by country in 2023 with key facts about global economic growth.

    Client-Klutzy Report

    ADVERTISEMENT
    See Also on Bored Panda
    #21

    Popular Names That Died Off On The Us

    Infographic showing fallen male baby names from 1900 to 2020, visualizing trends with interesting world facts.

    jpc4stro Report

    ADVERTISEMENT
    See Also on Bored Panda

    As for the aesthetic part, a step in the right direction would be choosing the right fonts. Two are more than enough – one for the title and one for the body text. A more fun and decorative one can be used for the header, while the remaining information can be formatted with a simpler one so it’s easily readable. The typeface should also reflect the topic. Storytelling that’s more youthful and entertaining deserves a font that portrays this.

    #22

    Evolution Of Helmet Design

    Medieval helmets timeline infographic showing development and types of helmets crafted into visual infographics about world facts.

    GeneticVariant Report

    ADVERTISEMENT
    See Also on Bored Panda
    #23

    The World’s 15 Most Popular Cocktails

    Infographic showing the most popular cocktails globally with visual facts crafted into an engaging infographic design.

    jpc4stro Report

    #24

    The Busiest Airports In 2023

    Infographic showing the busiest airports of 2023 by seat capacity, featuring main SEO keywords about world facts and visual infographics.

    jpc4stro Report

    #25

    Cities With The Most Millionaires In The World

    Infographic showing distribution of high-net-worth individuals across major global cities in visual facts about the world.

    giuliomagnifico Report

    ADVERTISEMENT
    See Also on Bored Panda

    The same goes for colors – try to keep them visually appealing and stick with three or four that work well together. Finally, the goal with these visual aids is to portray data in a simple way, so don’t overcrowd it. Leave plenty of space between images and statistics, and use as little text as possible.

    ADVERTISEMENT
    #26

    The Best-Selling Mobile Phones Of All Time

    Infographic showing top-selling mobile phones, highlighting sales figures of Nokia, Apple, and Samsung models globally.

    giuliomagnifico Report

    ADVERTISEMENT
    Add New Image This post is a community curated image gallery Add Image
    Add New Image

    Add Your Photo To This List

    Please use high-res photos without watermarks

    Upload Photo

    Not your original work? Add source

    Publish