Article created by: Rugilė Žemaitytė

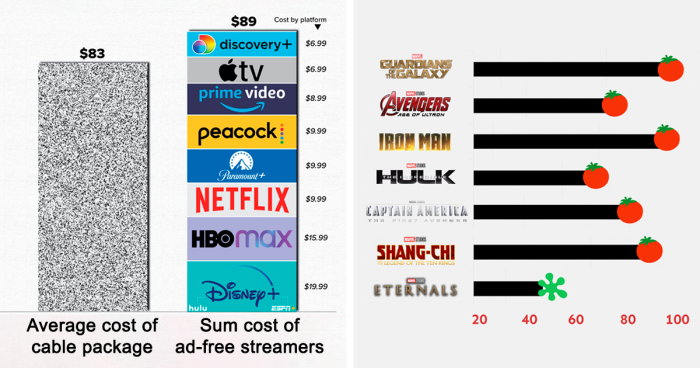
The subreddit r/dataisbeautiful truly lives up to its name. From global or internet trends to societal issues, this community covers it all in easy-to-understand visualizations that effectively convey otherwise complex information. Each graph, chart, or map has the potential to uncover patterns, expose correlations, or shed light on various topics. No wonder why as of today, over 19M people appreciate this subreddit.

So if you feel that sometimes life is just too difficult to comprehend, hopefully, this list will make you feel at least somewhat at ease knowing that even the most complex things can be summed up in a beautiful visualization.

To learn more about data and data analysis, Bored Panda reached out to Matthew Mayo, a Data Scientist and the Editor-in-Chief of KDnuggets, the seminal online resource for Data Science, Machine Learning, AI, and Analytics. Read the full interview with Matthew below.

More info: kdnuggets.com | Linkedin | Twitter | Instagram | Facebook

#1

Most Spoken Languages In The World

Bar chart showing total number of speakers for top world languages including English, Mandarin, and Hindi in data visualization.

neilrkaye Report

RELATED:
    #2

    Bolivia's Infant Mortality Has Dropped Below The World's Average

    Line chart showing Bolivia's infant mortality rate dropping 88% over 60 years compared to the world average in data visualization.

    latinometrics Report

    #3

    The Bedrock Geology Of North America

    Detailed geological map of North America showcasing terrain features and data visualization for data is beautiful insights.

    eon_james Report

    #4

    If There Were Only 10 People On Earth, This Is How Wealth Would Be Distributed

    Bar chart showing global wealth inequality in 2021 with data visualization of wealth distribution among 10 people, highlighting data is beautiful.

    rubenbmathisen Report

    #5

    The Most Streamed Programs

    Bar chart showing the most streamed programs in 2022 with minutes viewed in billions and a streaming remote.

    Dremarious Report

    #6

    Finland Joins NATO, More Than Doubling The Alliance's Border With Russia

    Map showing Finland joining NATO and the new military border length with Russia in key data visualization charts.

    giteam Report

    #7

    A Comparison Of Nato And Russia's Military Strength

    Comparison chart showing NATO vs Russia military personnel, armored units, air force, naval forces, and nuclear weapons data visualization.

    arshadejaz Report

    #8

    The Cost Of Cable vs. Top Streaming Subscriptions

    Bar chart comparing the average cost of cable versus top streaming subscriptions in 2023, illustrating data visualization.

    Dremarious Report

    #9

    Does Healthcare Spending Correlate With Life Expectancy?

    Scatter plot chart showing life expectancy versus health expenditure per capita comparing LatAm, Europe, and North America data insights.

    latinometrics Report

    #10

    Rotten Tomatoes Score Of Movies By Marvel Studios

    Bar chart showing Rotten Tomatoes scores of Marvel Studios movies with tomato icons representing ratings for data visualization.

    keshava7 Report

    #11

    Norway's Oil Fund vs. Top 10 Billionaires

    Bar chart comparing Norway's oil fund size with the combined wealth of the top 10 richest people, data visualization.

    rubenbmathisen Report

    #12

    Population Density Of Egypt

    Population density map showing data visualization of urban areas and river regions using data is beautiful charts concept.

    symmy546 Report

    #13

    Actors/Actresses With The Most Oscar Wins

    Gold Oscar statue surrounded by data charts showing actors with the most Oscars in a visual data is beautiful infographic.

    giteam Report

    #14

    Top Googled Games In Europe, December 2022

    Map of Europe showing top Googled games by country in December 2022 with data visualization from popular trends and charts.

    desfirsit Report

    #15

    The Rise And Fall (And Rise) Of "Alexa"

    Line chart comparing babies named Alexa and Amazon Echo sales from 1960 to 2020 showing trends in data visualization.

    CheeryOaf Report

    #16

    How Long Ago Were The Hottest And Coldest Years On Record Around The World

    World maps showing the hottest and coldest years on record using data visualization and charts for data is beautiful.

    neilrkaye Report

    #17

    Much Of Latin America Has Caught Up To The 90%+ Literacy Rate The Us Has Had Since 1900

    Line chart showing literacy rate growth in Latin American countries from 1900 to 2020 data is beautiful chart.

    latinometrics Report

    #18

    How To Mathematically Win At Rock, Paper, Scissors

    Bar chart showing most popular first move in Rock Paper Scissors with percentages, illustrating data is beautiful insights.

    waynehihihi Report

    #19

    Do You Belief In Ghosts?

    Chart showing belief in ghosts decreasing by education level, visualized with ghost icons and percentage data points.

    GradientMetrics Report

    See Also on Bored Panda
    #20

    Dating In The Internet Age: 1995 vs. 2017

    Bar graph comparing how couples met in 2017 versus 1995, highlighting changes in online dating trends and social interactions.

    CognitiveFeedback Report

    #21

    My 2-Month Long Job Search As A Software Engineer With 4 Yeo

    Flow chart showing application outcomes and interview stages in a data is beautiful visualization of hiring processes.

    a__side_of_fries Report

    #22

    Obesity Rate (%) By Country Over Time

    Line chart showing obesity rates by country from 1975 to 2020, highlighting trends in global data visualization.

    YakEvery4395 Report

    #23

    The Popularity Of The Name "Mabel" In The United States Skyrocketed After Gravity Falls Came Out

    Bar chart showing the rise and fall of the name Mabel in the USA with a spike linked to Gravity Falls in recent years.

    Aloiciousss Report

    #24

    I Asked 1000 People To Take Their Pic For Free On The Street

    Flow chart illustrating interactions with strangers, showing data visualization of offers, hirings, and social outcomes with portraits mosaic.

    gonzalocdlp Report

    #25

    A Detailed Shaded Relief Map Of Manhattan New York Rendered From Lidar Data

    A detailed 3D map visualization showing New York City neighborhoods with data is beautiful chart style perspective.

    visualgeomatics Report

    #26

    Japan's Work To Reduce Homelessness

    Bar chart showing the decline of homeless people in Japan from 2007 to 2020 in a data is beautiful style visualization.

    Xsythe Report

    #27

    Household Ownership Of Consumer Goods In India

    Bar chart showing percentage of Indian households owning consumer products like mobile phones, fans, TVs, and cars, data visualization.

    pratapvardhan Report

    #28

    Relative Google Search Interest Of Popular TV Series After Last Episode Air Date

    Chart showing relative Google search interest over years for popular TV series, highlighting trends in data visualization and insights.

    veleros Report

    #29

    U.S. Counties With More People Than The State Of Wyoming

    Map of U.S. counties with more people than Wyoming, highlighting population data in a visual data is beautiful chart format.

    academiaadvice Report

    See Also on Bored Panda
    #30

    Us States Sorted By Life Expectancy, Colored By Biden's Share Of The 2020 Presidential Election

    Bar chart showing life expectancy by state with color-coded Biden vote percentages, highlighting data visualization trends.

    DouweOsinga Report

    #31

    The Cost Of The 2022 FIFA World Cup In Qatar Is Astronomical, Even When Comparing To The Gdp Of The Host Country In The Host Year

    Bar chart showing unadjusted World Cup hosting costs in USD billions, highlighting a sharp increase for 2022 Qatar.

    Savoy_Cabbage Report

    #32

    Global Wealth Inequality In 2021 Visualized By Comparing The Bottom 80% With Increasingly Smaller Groups At The Top Of The Distribution

    World map showing wealth distribution between the bottom 80 percent and the top 5 percent by country data visualization.

    rubenbmathisen Report

    #33

    Number Of "Birthday" Posts On My Facebook Wall Per Year

    Line chart showing the number of birthday posts on Facebook wall per year from 2008 to 2021, data visualization.

    josigold Report

    #34

    Price Of Full Tank Of Gasoline (60 L) As A Percentage Of Average Monthly Net Salary Across The World

    World map showing percentage of monthly salary spent on a full tank of gasoline, highlighting data is beautiful charts.

    kiwi2703 Report

    #35

    The Probability Of Winning A Battle As An Attacker In The Board Game Risk

    Heatmap chart showing percentage success based on number of attackers versus number of defenders, data visualization concept.

    joweich Report