ADVERTISEMENT
Article created by: Mantas Kačerauskas

How many chocolate chip cookies do you need to fill you up? Me, I don’t get out of bed without a package. ‘Cause when it comes to putting food in your mouth, how much doesn’t count as long as it tastes good. But imagine what a favor we’d be doing our bodies simply by starting to listen to what they say. And it doesn’t take a whole lot.

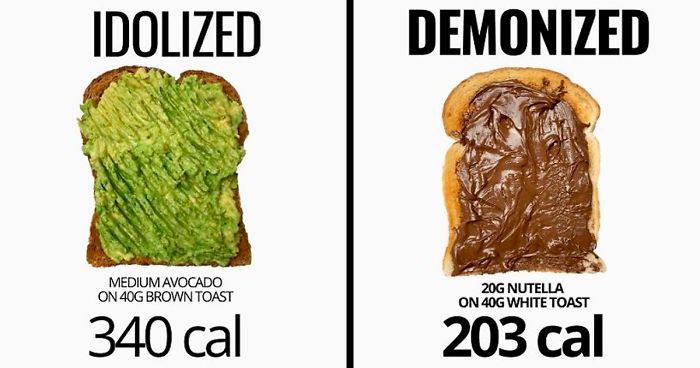
Swapping food for healthier alternatives is the way to go, and we present you some of the most easy-to-understand healthy charts that speak numbers and quantities. Take notes, everyone—we are about to build a better snack menu no one will ever feel guilty for.

Scroll down below for Bored Panda’s interview with Graeme Tomlinson, the man behind the widely popular Instagram account The Fitness Chef known for myth-busting nutrition infographics about making wise food choices.

#1

Comparison food chart showing lower quality convenience foods at £8 versus higher quality options at £32, highlighting food industry issues.

thefitnesschef_ Report

RELATED:
    #2

    Comparison food chart showing 200g sweet potato with 196 calories and 200g white potato with 160 calories.

    thefitnesschef_ Report

    #3

    Comparison food chart showing 100g banana chips with 524 calories and 35g sugar versus 100g raspberries with 31 calories and 4g sugar.

    thefitnesschef_ Report

    #4

    Comparison food chart showing calories in just bread versus bread with toppings including jam and peanut butter.

    thefitnesschef_ Report

    ADVERTISEMENT
    #5

    Comparison food chart showing snacking at work with high calorie vs low calorie options per week totaling 5007 and 1988 calories.

    thefitnesschef_ Report

    ADVERTISEMENT
    #6

    Comparison of suggested serving versus typical serving size for Twix bars, illustrating food portions and calorie intake differences.

    thefitnesschef_ Report

    #7

    Chart showing calories and sugar content per 100g of various fruits to change the way you view some foods.

    thefitnesschef_ Report

    #8

    Chart showing refrigerator storage times for raw and cooked beef, chicken, and salmon with freezer durations for each food type.

    caligirlgetsfit Report

    ADVERTISEMENT
    #9

    Chart showing foods that fill you up with categories like bakery, sweets, cereal, protein, fruits, and carb-rich foods including potatoes.

    thefitnesschef_ Report

    ADVERTISEMENT
    #10

    Food chart showing ingredients and nutrition of almond flour cookie dough balls ready in 5 minutes.

    meowmeix Report

    #11

    Water intake chart showing daily hydration needs based on activity level and climate with a pee color scale for guidance.

    thrivewithduff Report

    #12

    Chart showing non dairy and dairy sources of calcium with various foods including tofu, almonds, milk, cheese, and leafy greens.

    thesavvydietitian Report

    ADVERTISEMENT
    #13

    Comparison food chart showing one fast food meal versus a full day of eating with equal calories, highlighting food choices.

    thefitnesschef_ Report

    ADVERTISEMENT
    #14

    Comparison chart of baked, mashed, and fried sweet potatoes and potatoes with calories and fat per 100g from food charts online.

    equalution Report

    #15

    Comparison food chart showing calories, protein, sugar, and fiber in snacks and drinks that may change the way you view some foods

    thefitnesschef_ Report

    #16

    Food chart showing calories consumed from biscuits per day, week, month, and equivalents in Big Macs and wine bottles.

    thefitnesschef_ Report

    ADVERTISEMENT
    #17

    Chart showing vitamin C content in fruits and vegetables with mg per 100g for each item in a food chart comparison.

    thefitnesschef_ Report

    ADVERTISEMENT
    #18

    Food chart comparing calories and volume of oils, peanut butter, chocolates versus 600g strawberries, highlighting calorie density.

    thefitnesschef_ Report

    #19

    Planted-based protein sources chart showing chickpeas, lentils, peas, tempeh, black beans, and hemp seeds protein content.

    maxlugavere Report

    #20

    Comparison food chart showing protein content in various products, highlighting common misconceptions about high protein foods.

    thefitnesschef_ Report

    ADVERTISEMENT
    #21

    Comparison food chart showing calories in 14 large caramel macchiatos, lattes, cappuccinos, and Americanos per week.

    thefitnesschef_ Report

    ADVERTISEMENT
    See Also on Bored Panda
    #22

    Comparison food chart showing calories and nutrients in a clean wellness breakfast versus a McDonald's breakfast meal.

    thefitnesschef_ Report

    #23

    Chart showing 9 low sugar fruits with percent of total digestible carbohydrate including avocados and berries.

    maxlugavere Report

    #24

    Chart showing calorie counts of common condiments including gravy, cranberry sauce, honey mustard, mint jelly, seafood sauce, and garlic aioli.

    equalution Report

    ADVERTISEMENT
    See Also on Bored Panda
    #25

    Comparison food chart on calories showing snacks and meals for listening to your body versus learning your body.

    thefitnesschef_ Report

    ADVERTISEMENT
    See Also on Bored Panda
    #26

    Meat food chart showing calories and protein per 100g of various meats including rib-eye, chicken breast, and pork chop.

    thefitnesschef_ Report

    Alaina McAuliffe
    Community Member
    2 months ago Created by potrace 1.15, written by Peter Selinger 2001-2017

    Why would you not put these in order of either cal or protein? This is useless as an image.

    #27

    Comparison of cheese toast showing portion control with calories for food charts that may change how you view foods.

    thefitnesschef_ Report

    ADVERTISEMENT
    See Also on Bored Panda
    #28

    Comparison chart showing protein content of plant based and animal based foods per 100g to change the way you view some foods.

    thefitnesschef_ Report

    #29

    Comparison food chart showing calories of brown rice, wholewheat pasta, and bread versus white rice, white pasta, and white bread with focus on food charts.

    thefitnesschef_ Report

    ADVERTISEMENT
    See Also on Bored Panda
    #30

    Chart showing 9 top foods for gut health including garlic, leeks, kale, turmeric, and their prebiotic and antioxidant benefits.

    maxlugavere Report

    ADVERTISEMENT
    See Also on Bored Panda
    #31

    Comparison of 1000 calories from high-calorie foods versus a larger volume of lower-calorie foods in a food chart.

    thefitnesschef_ Report

    #32

    Calorie chart of various types of bread including slices, rolls, buns, and toasted bread for food charts SEO keyword.

    thefitnesschef_ Report

    #33

    Comparison food chart showing calories in large versus smaller portions of popular foods and drinks with food charts SEO focus.

    thefitnesschef_ Report

    ADVERTISEMENT
    See Also on Bored Panda
    #34

    Comparison food chart showing morning routine calories at work with high-calorie vs low-calorie options for better food choices.

    thefitnesschef_ Report

    ADVERTISEMENT
    #35

    Low sugar smoothie ingredients food chart featuring cauliflower, avocado, celery, zucchini, berries, and spinach on white surface

    genuinehealth Report

    #36

    Chart comparing low calorie food swaps with calories listed, illustrating popular foods versus healthier lower calorie alternatives.

    thefitnesschef_ Report

    #37

    Comparison food chart showing calories in vodka with regular cola versus vodka with cola zero, highlighting calorie differences.

    thefitnesschef_ Report

    ADVERTISEMENT
    #38

    Six food charts showing pizza variations with calorie counts on blue plates, highlighting unique food choices and calorie info.

    meowmeix Report

    ADVERTISEMENT
    #40

    Comparison food chart showing avocado on brown toast with 340 calories versus Nutella on white toast with 203 calories.

    thefitnesschef_ Report

    Data1001
    Community Member
    2 months ago Created by potrace 1.15, written by Peter Selinger 2001-2017

    It's more about where your calories are coming from. The avocado has effectively zero grams of sugar per 2 tablespoon (approx 37 grams) serving, whereas the Nutella has 21 grams of sugar per 2 tablespoon serving.