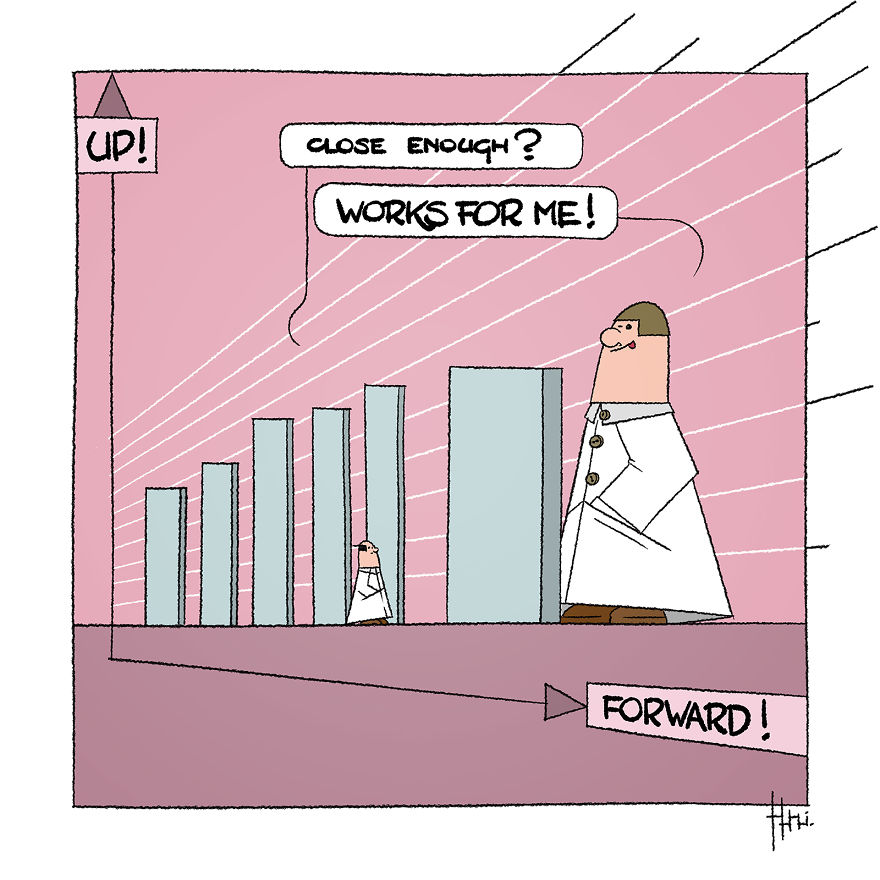
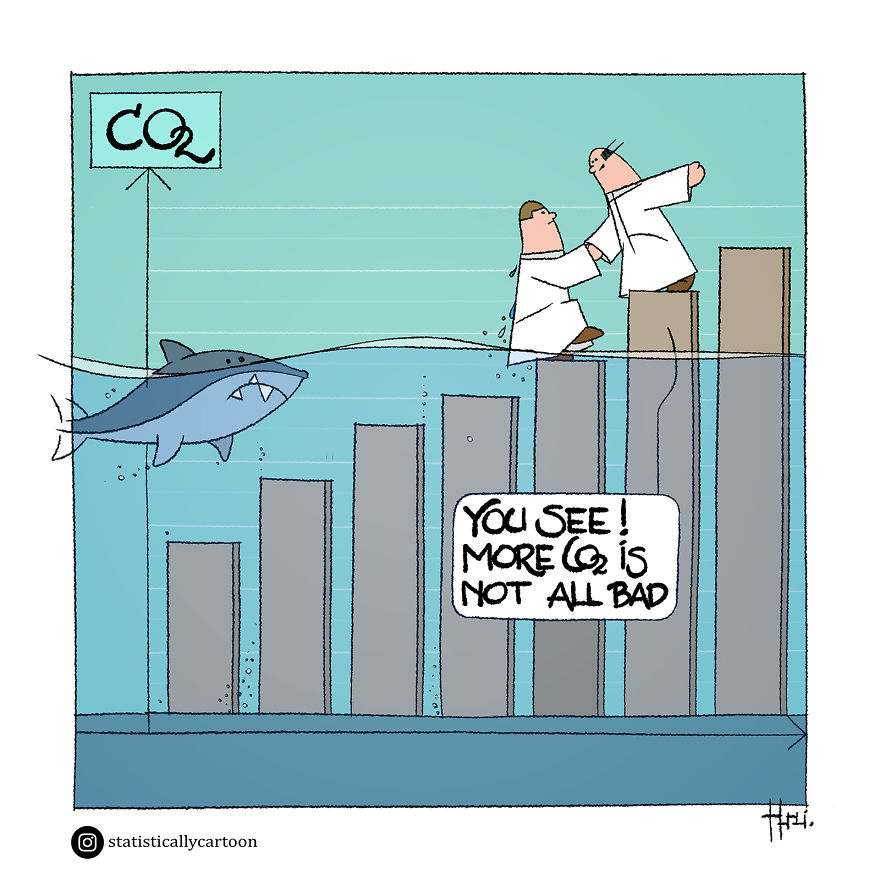
I'm a digital artist and visual developer, or vice versa, living in Belgium (Europe that is). Yet, I do like my analog pencil, not because I can draw (which I can't), but it allows me to think more freely. I wanted to draw comics when I was young, but then I became an engineer and ended up doing 3D animation and post-production. So I tend to do anything "visual" I like... like now, drawing cartoons again as I did 30 years ago.
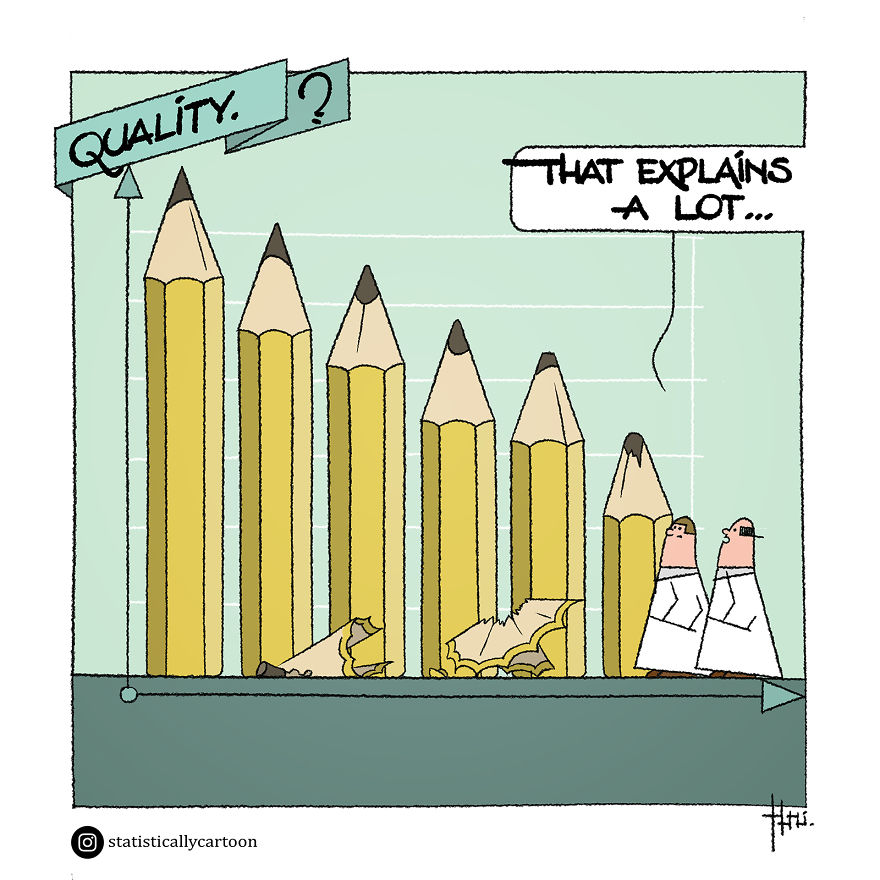
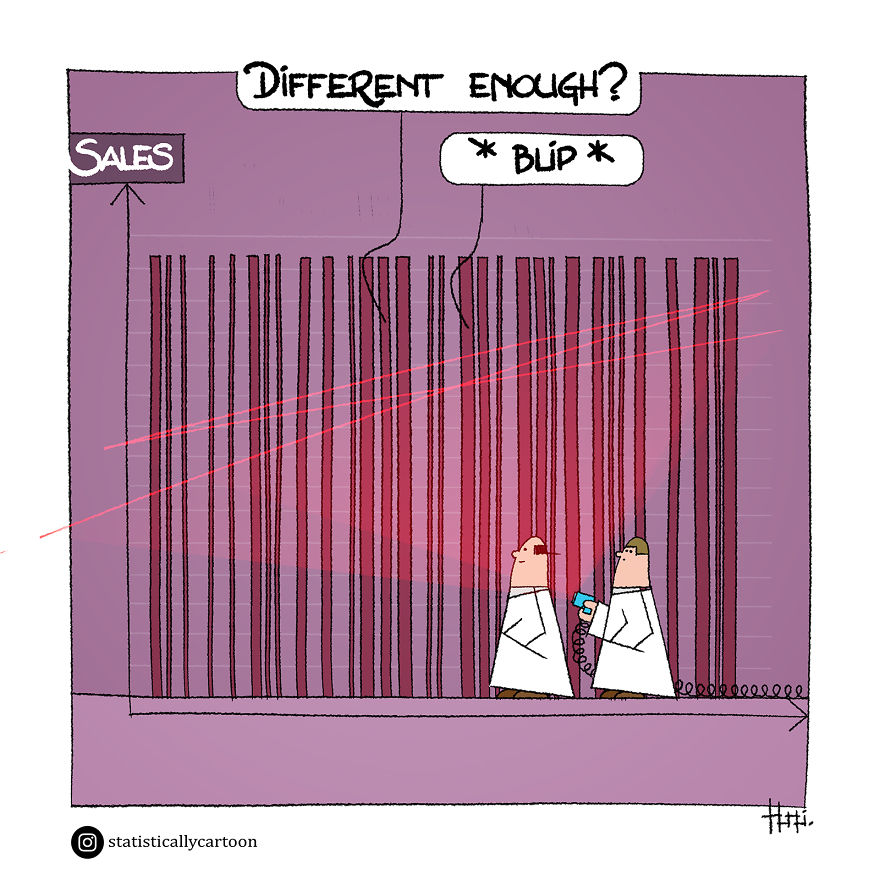
In November 2019, I found my niche in statistics and them being (mostly) (ab)used in science, media, politics... And though I intended to steer clear from current affairs, a few months after I started the series, the earth was struck with Corona, media was flooded with statistics, and I couldn't help but touch upon the topic, gently. I do prefer the absurd and witty, however.
Not always succeeding, but plenty of ideas to keep trying. The top spot and a true master in that field? Tom Gauld, whose work I truly admire (and he can draw).
So here is my absurd cartoon series with the occasional glimpse of reality. I hope you enjoy it. And if you do, find out more on my Instagram.
More info: Instagram | Facebook
This post may include affiliate links.
For Damien, and all our nerdy friends. Biting social comment in this!
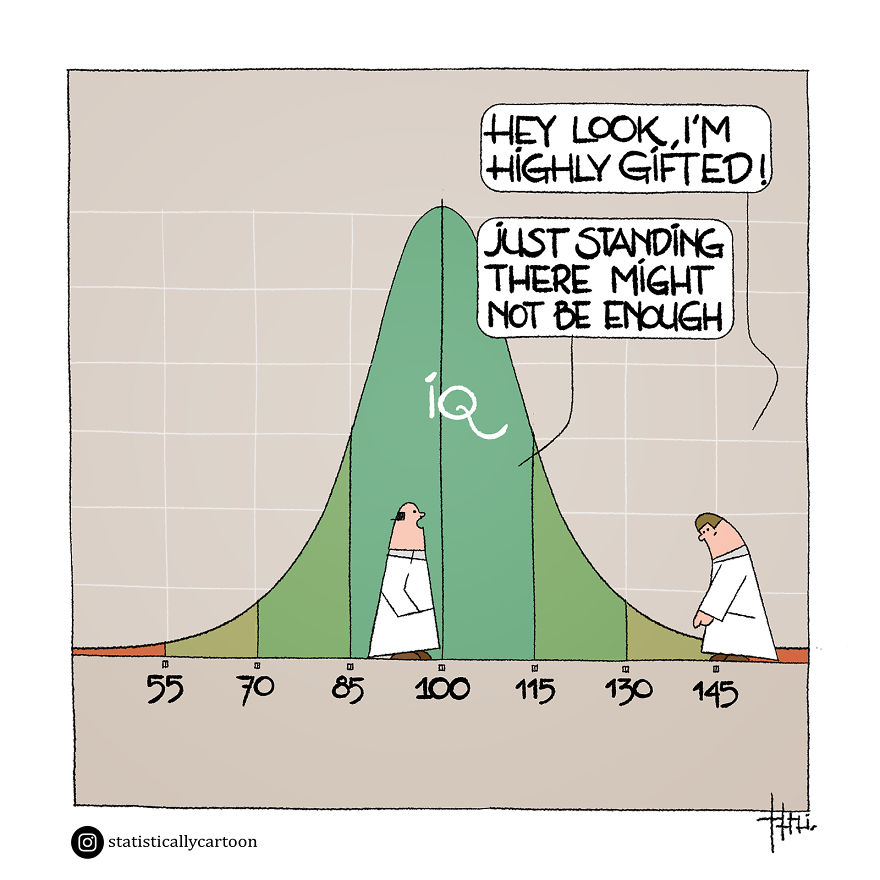
I have a similar problem with a person I have known for a long time. Her IQ tested as "exceptional," so she smugly assumes that she is right about everything without doing the necessary research to come up with a well-reasoned opinion. While it might make her good presidential material, it is frustrating at times.
Presidential material, huh? Apparently, you don't need an exceptional IQ to be president. But, I digress...
Load More Replies...A person's IQ score was originally calculated by dividing a person's mental age by their chronological age and then multiplying by 100. ... So IQ is a measure of the mismatch between a child's mental and chronological ages. It doesn't mean you're smart.
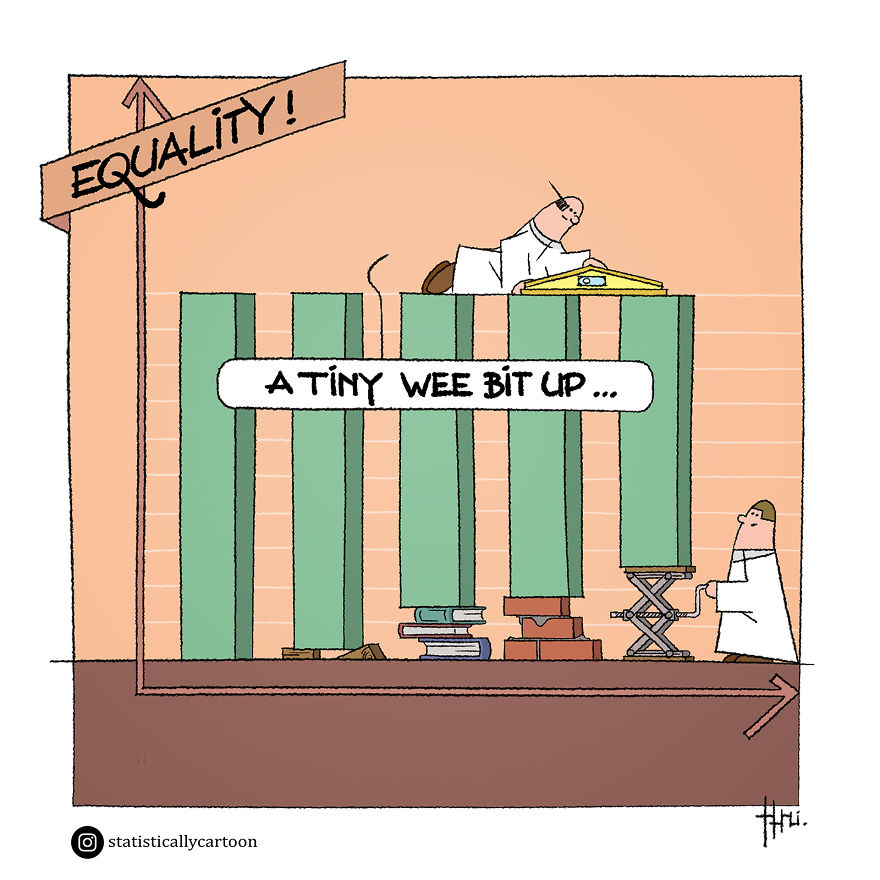
If we are all "Equal", why do we have "job interviews"? Shouldn't the jobs just go to first in best dressed?
Exactly. Equality is nonexistent politically correct fabricated fantasy. The proof is that it only applies to humans. "All humans are equal. We all have the same qualities, skills and traits. Saying Negros (generally) are good at singing and dancing or the Scottish and Germans are good at engineering is RACIST!!!. Saying men are stronger than women is SEXIST!! etc.But apparently it's totally OK to say German Shepards are good at being Police/Guard dogs and Kelpies are excellent sheep herders. Or crows are very good at using objects as tools to help them get food and pigeons are useless retards that s**t everywhere. Yes! That's right! Every single living plant and animal species and their various breeds (races) on the planet all have different levels of skills, qualities, abilities. Some are absolutely useless and have no remarkable abilities at all like pigeons, or some are very talented at one skill like sheep herding Kelpies. But not humans. We're all "equal".
We're also the only species that survive death (apparently) and get to live in a fantasy afterlife world (Lucky us!). Intelligent, emotional, and self-aware beings like whales, dolphins, elephants, and our fellow members of the "Four Great Apes" Chimps, Gorillas, and Orangutans (Yes Humans are the fourth one) get short-changed. Humans. Their best overall ability as an entire species is making up HEAPS of b******t to make it's individual members "feel better".
Load More Replies...If you send me your address I'll send you a framed copy...
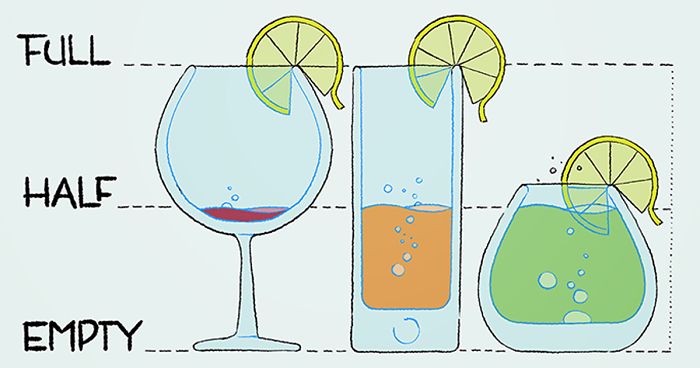
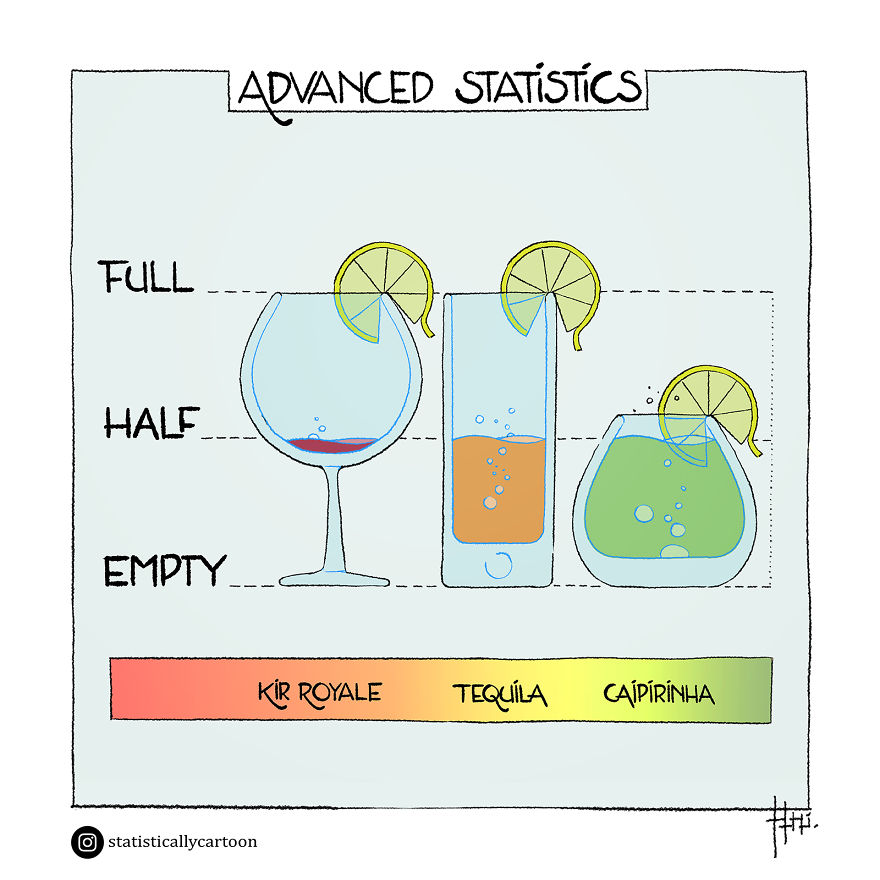
Load More Replies...Adding a straw to the last one, which came up to the "full" line, would make it even better
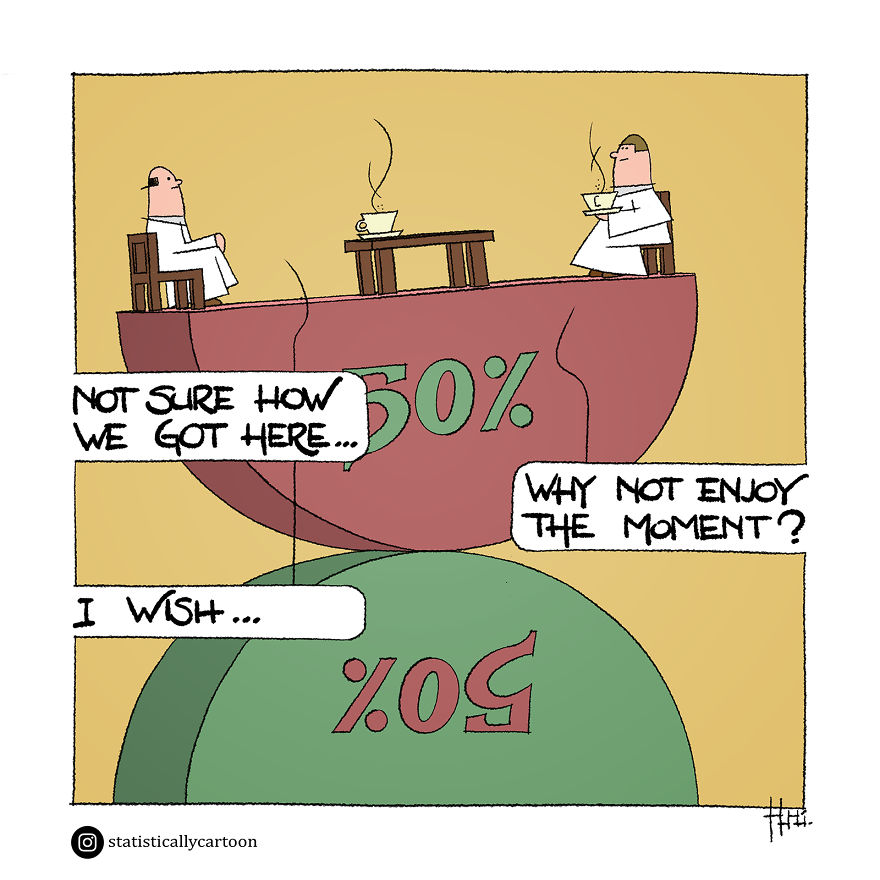
LOL In this case "half" a caipirinha if done right is enough to knock you on your a$$
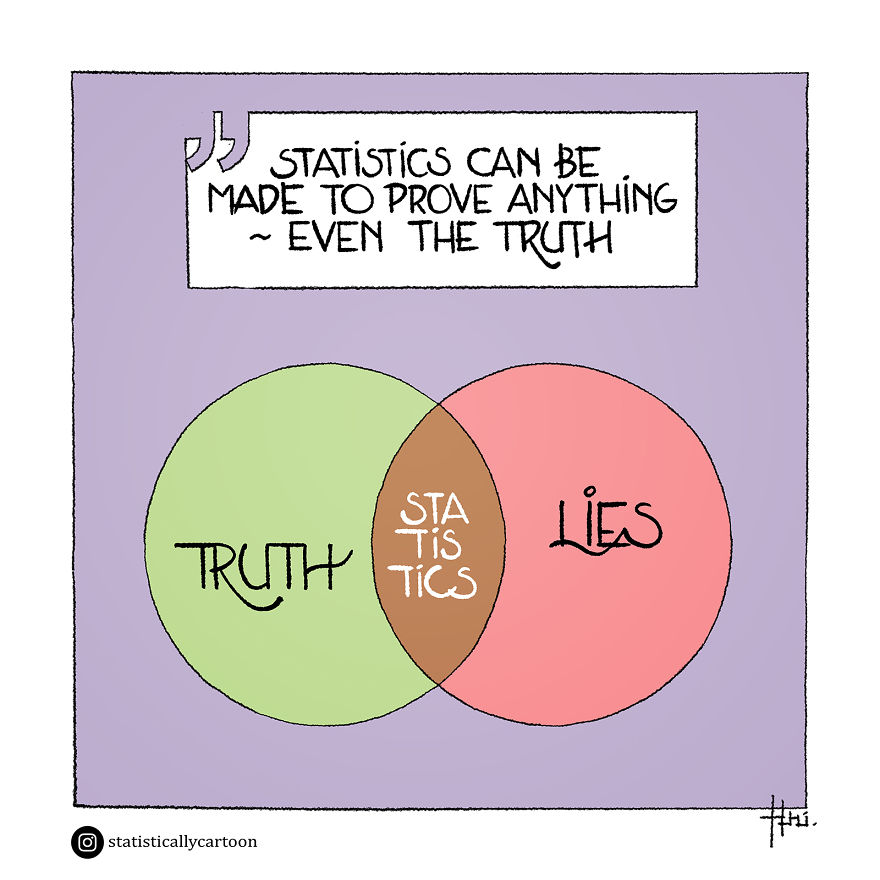
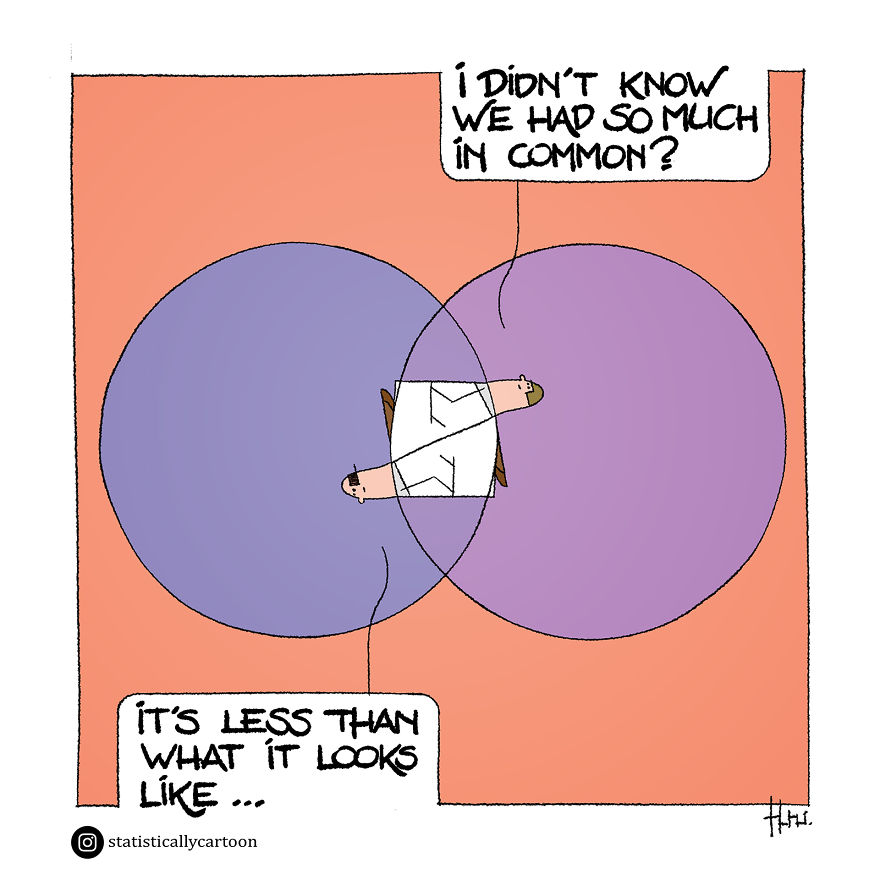
Is it just my interpretation, or does this Venn diagram say that statistics are both truth and lies… rather than that statistics can be used to back both truth and lies?
There are three kinds of lies: lies, damned lies, and statistics. - Attributed (perhaps wrongly) to Benjamin Disraeli, popularized by Mark Twain
"You can use logic to justify anything. That's its power. It's also its flaw" - (Captain Janeway, USS Voyager).
As Winston churchill once said, "... there's lies, damned lies and ther's statistics..." ;o)
Cause I love the adrenaline in my veins. Sorry, I had to
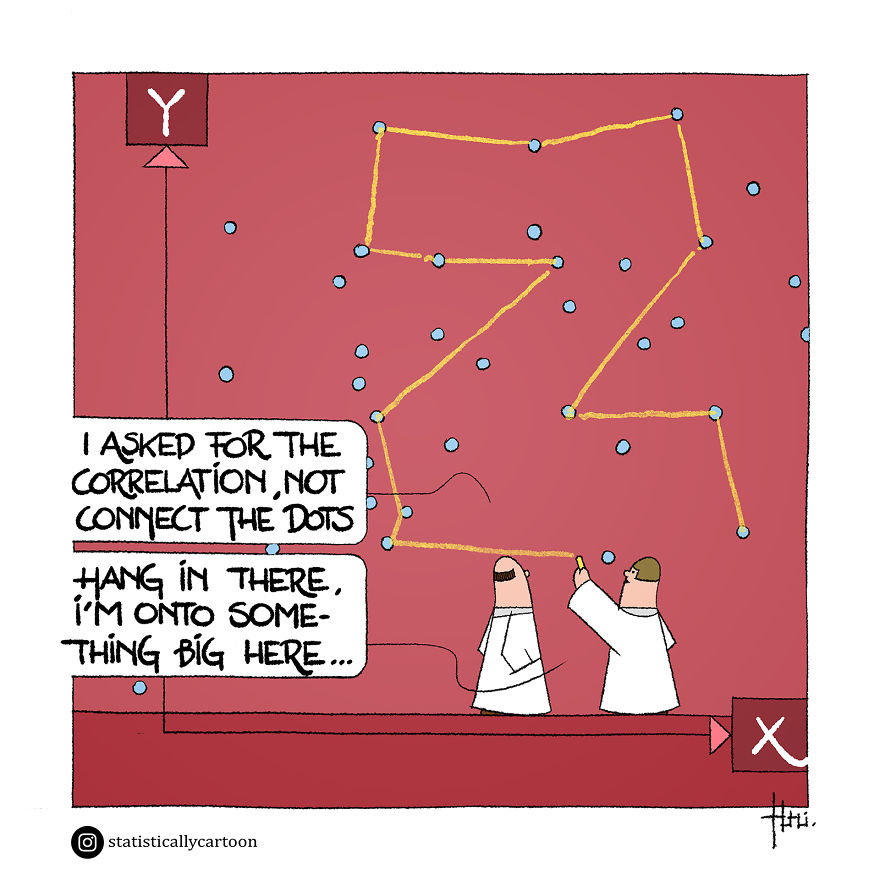
Load More Replies...Lol, reminded me of my first semester of college, the Methods in Biology professor almost pulling her hairs off when explaining that you.do.not.connect.the.dots (everyone was doing right, she was probably frustrated with ppl in general, not with the class)
This has nothing with what you said, but I just think it's so funny that the word "semester" means something totally different in Sweden and every time I see it, I think it's funny. I know what it means in this situation, but in Sweden the word "semester" means vacation. I don't know about you, but I think it's hilarious :) sorry for be so off topic.
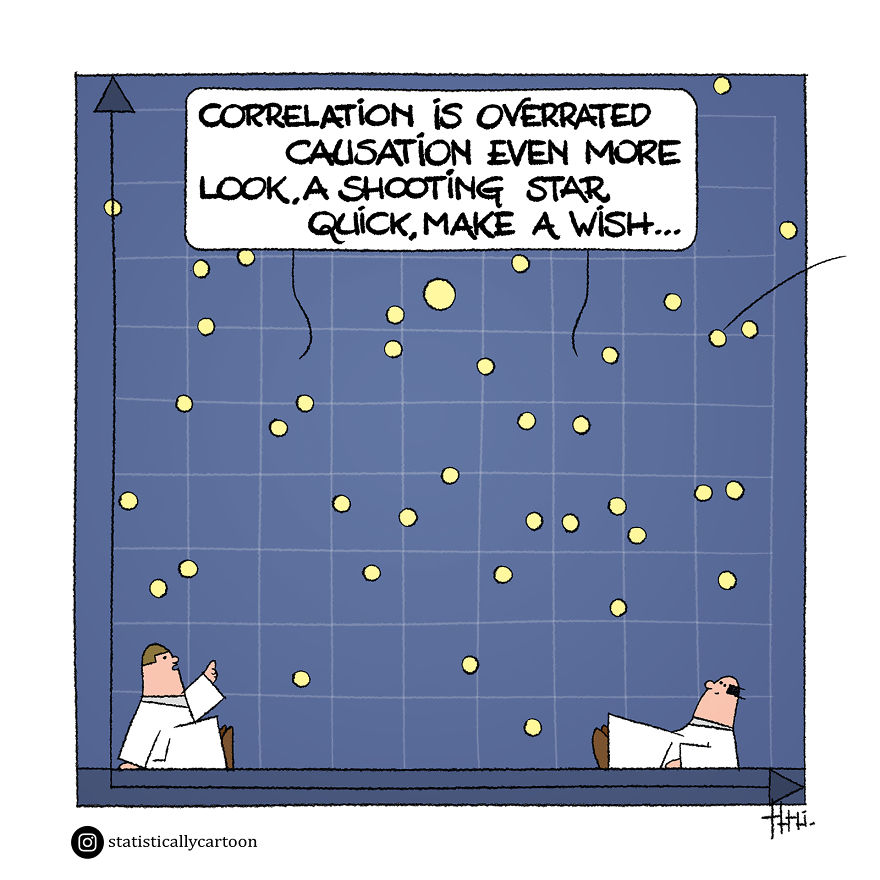
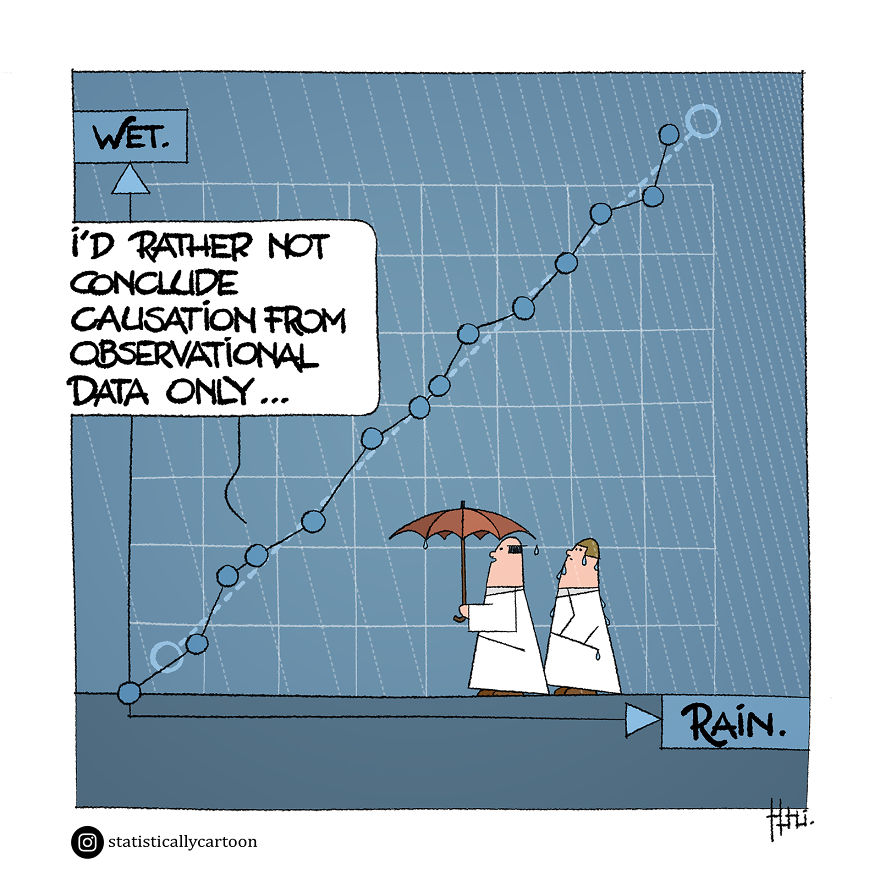
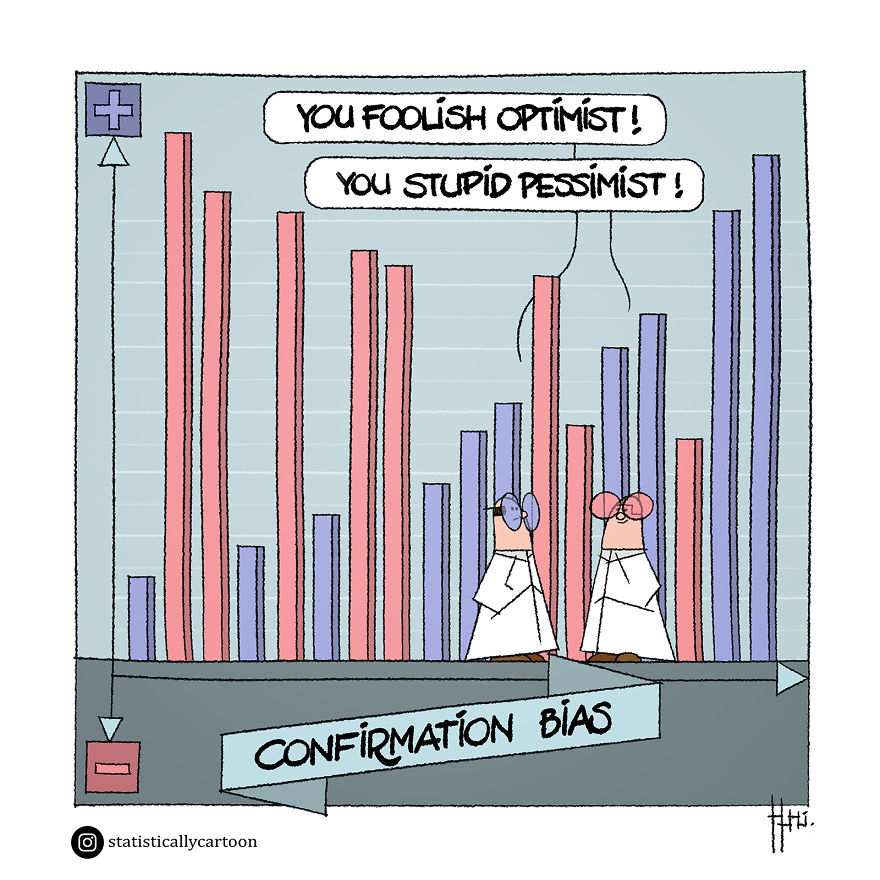
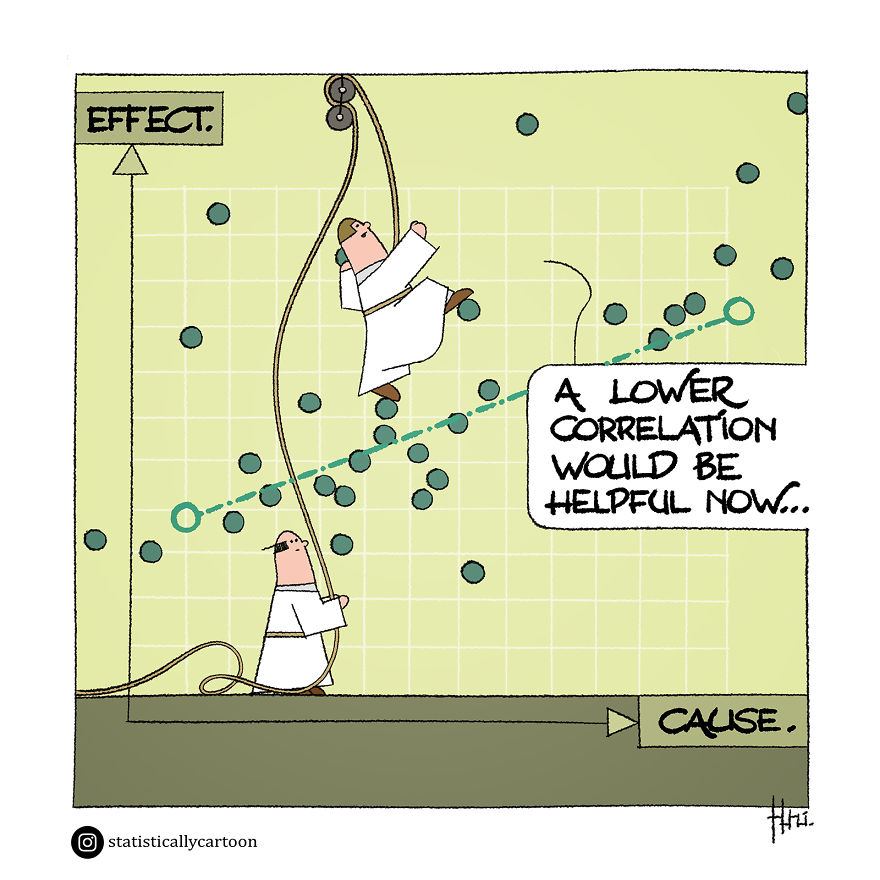
Load More Replies...So many times in the news or in "scientific" reports in social media, people do show correlation, but assume it is proof of causation. That's the cause of so many mistaken beliefs. It's often confirmation bias.
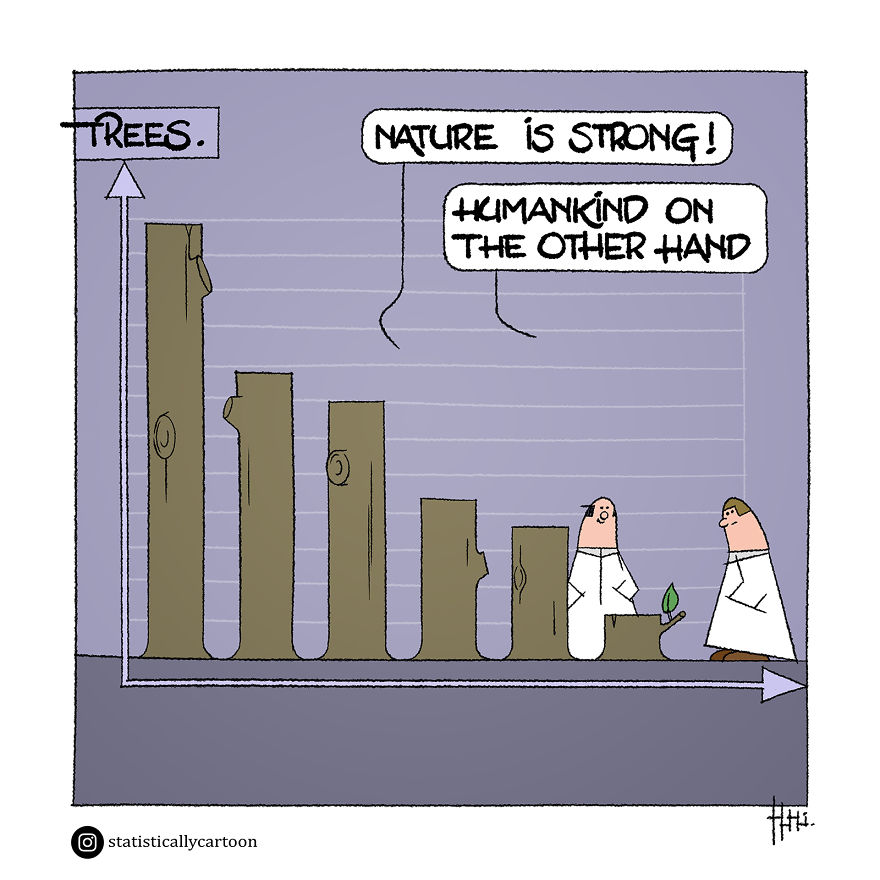
If there's even anywhere they can remain
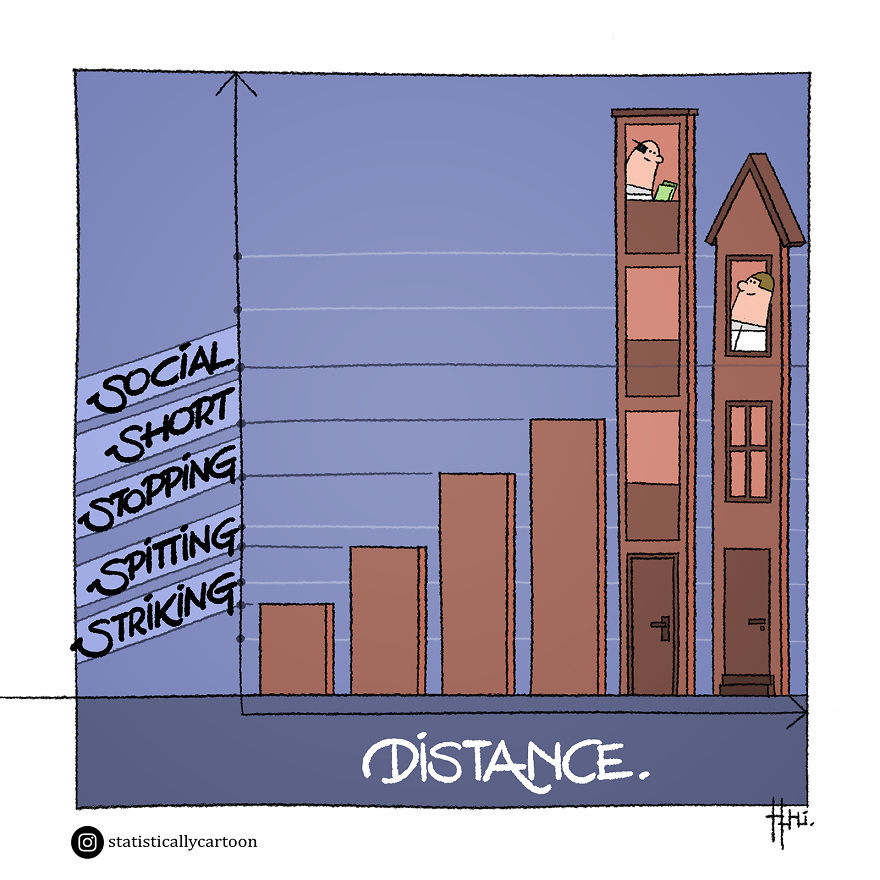
Load More Replies...This one reminds me of Master of Olympus game, doric was my favorite when decorating the cities
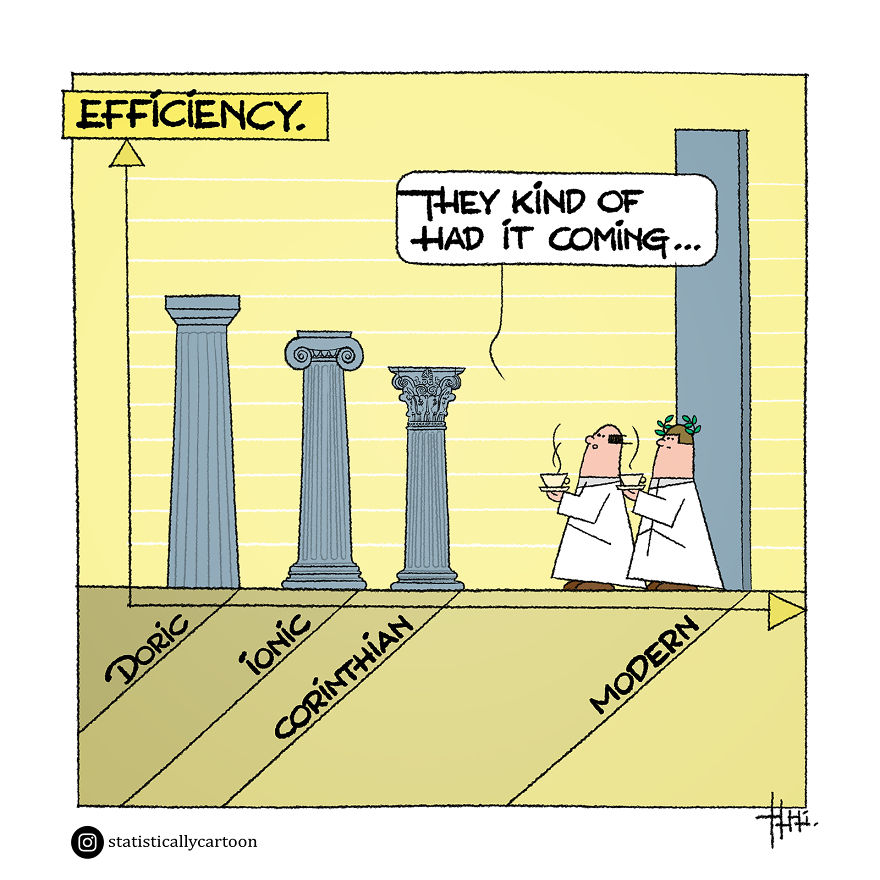
No. The Doric was the shortest and the Corinthian the tallest in reality.
This is rather arrogant. Some of the things that were the downfall of the Ancient Roman culture are popular again, and you think modern culture is so great and advanced? Ha!!! Human nature never changes.
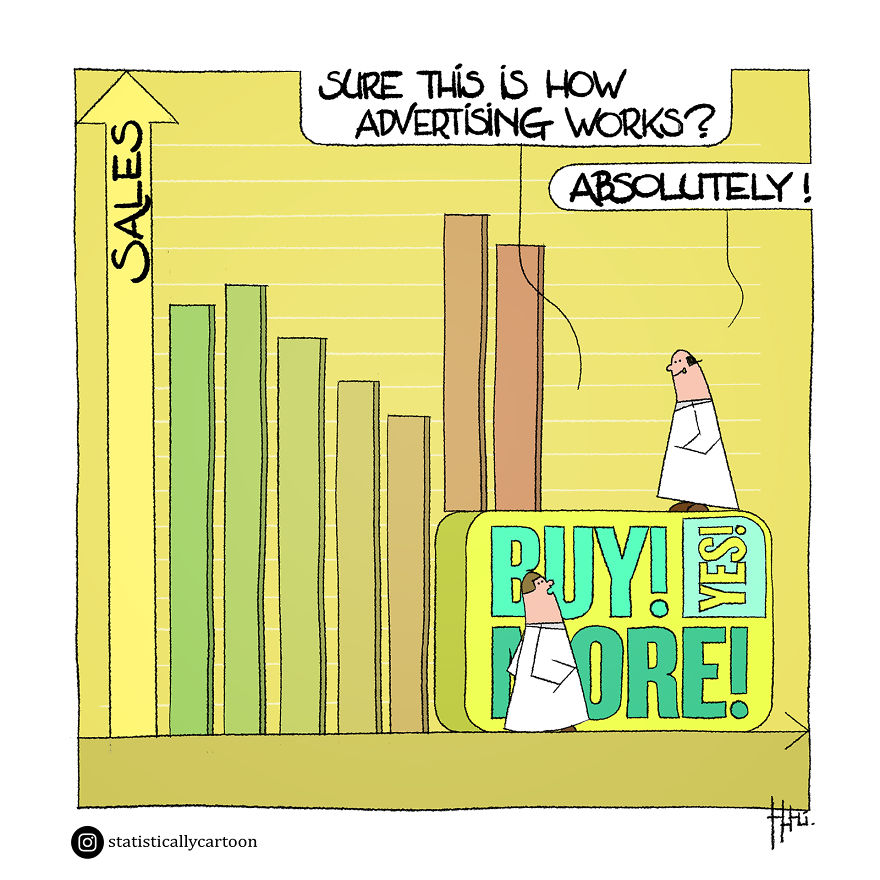
It really does though. People see something enough, and are told it's good enough times, you don't even need to tell people reasons to buy it. They just buy it.
OH god the agony LOL Reminds me of the hell of doing my PhD
Load More Replies...Darn, I've forgotten all about these concepts. I wish I couldgoback to high school now that I know what things I would like to remember from classes.
Me too. Quantum physics is the hardest subject. It makes me feel like either I'm a very smart idiot, or scientists are only pretending to understand.
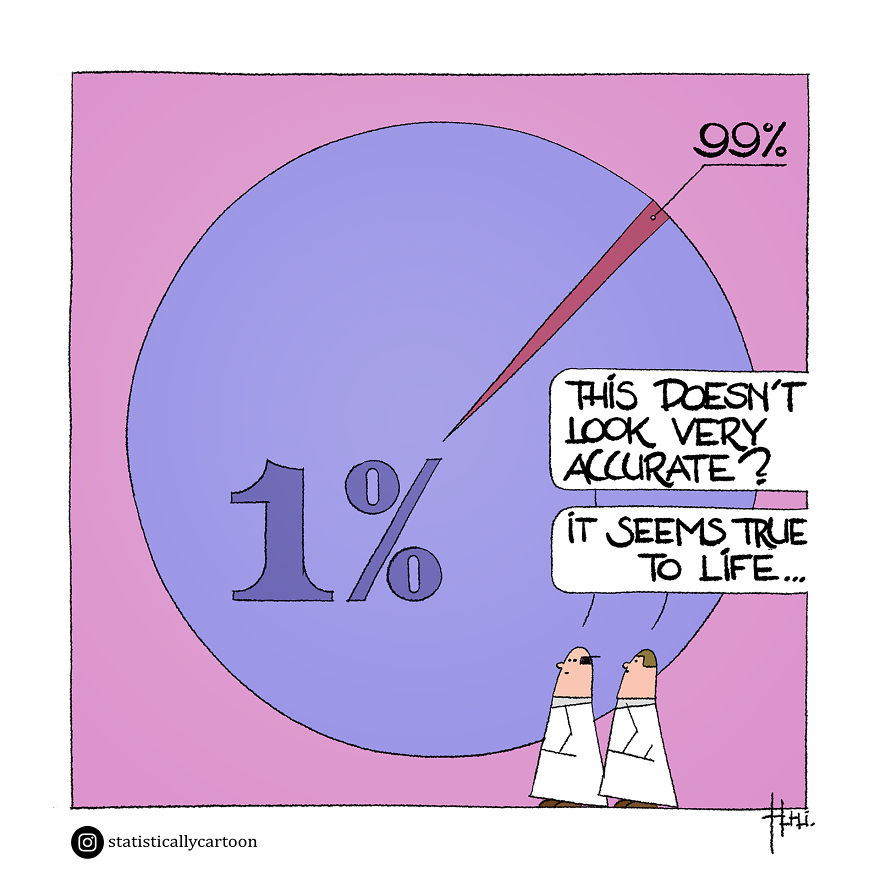
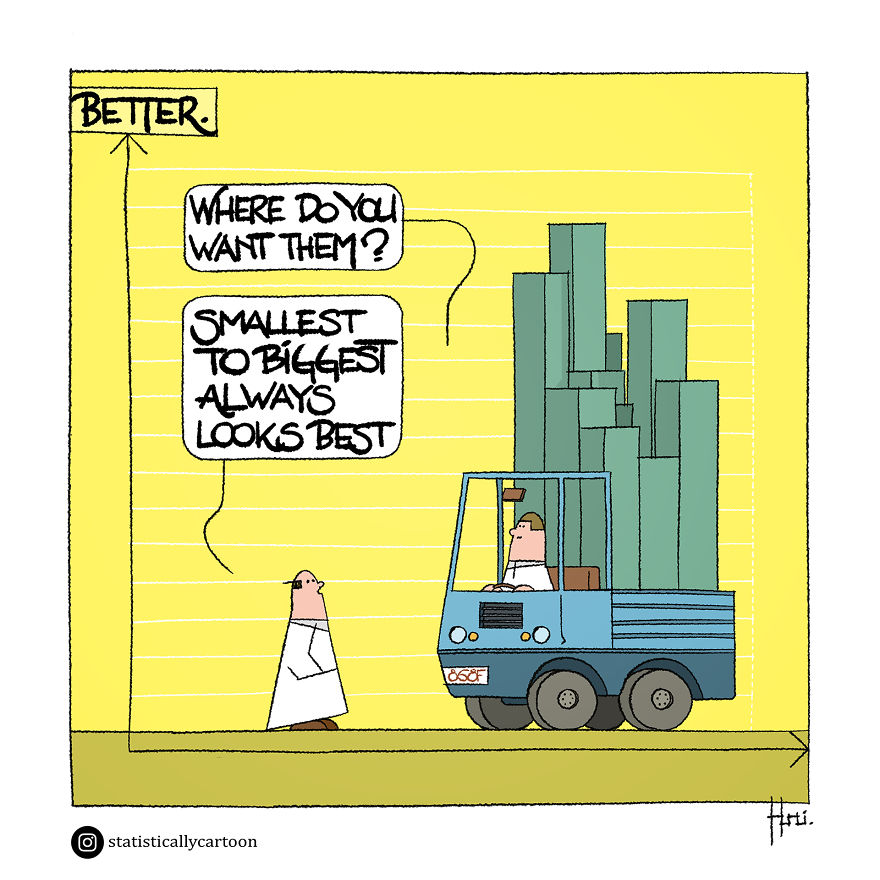
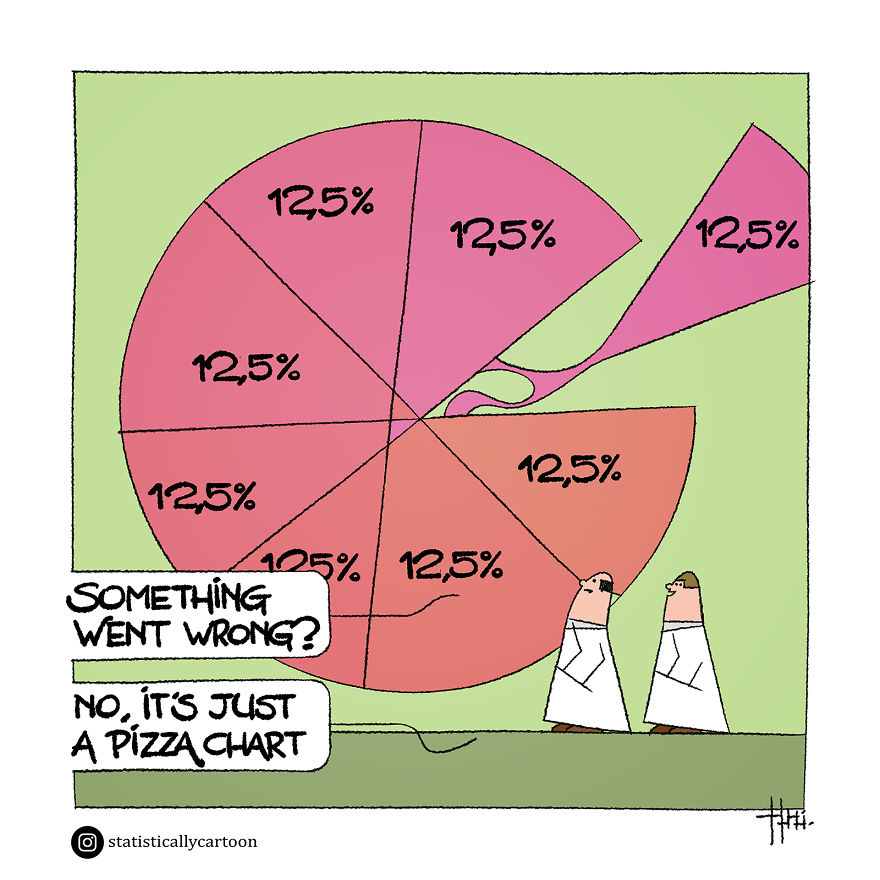
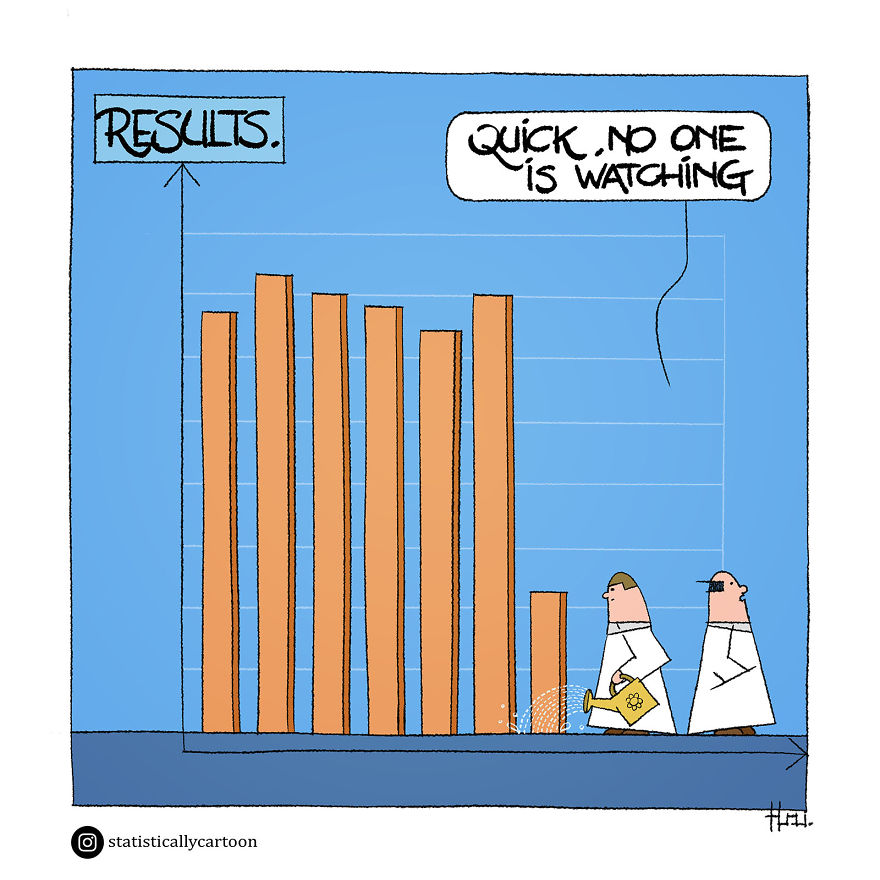
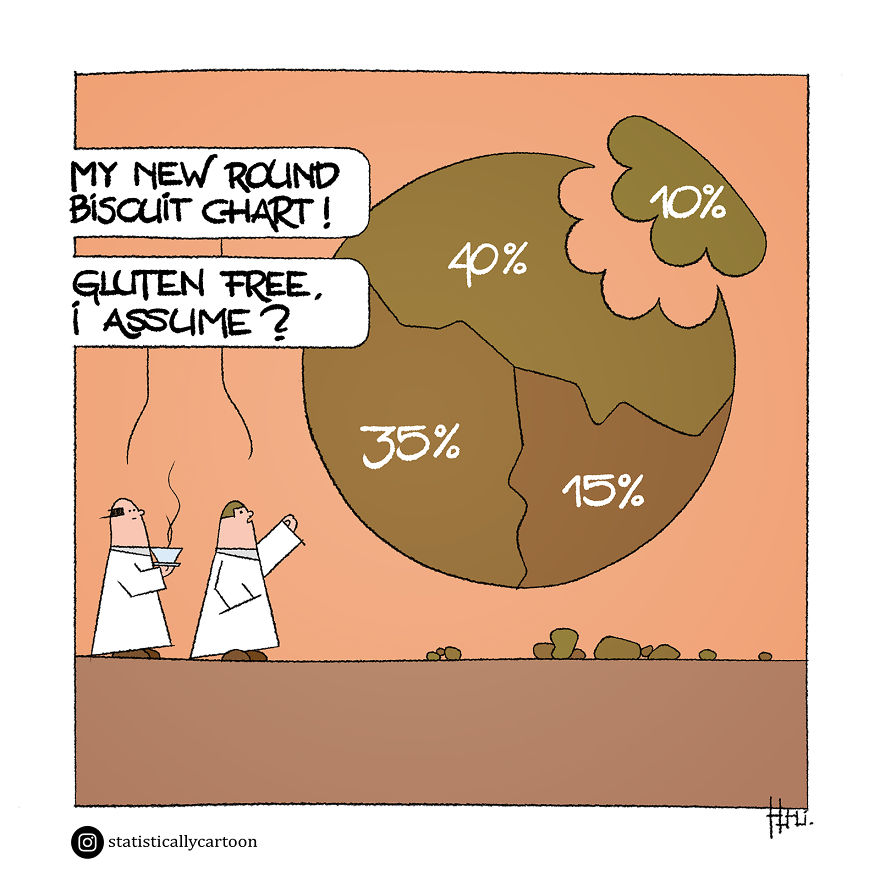
Load More Replies...I saw this kind of fudging of data in the wild once (with a pie chart) and fell for it. Luckily the result so weird someone had me take a second look.
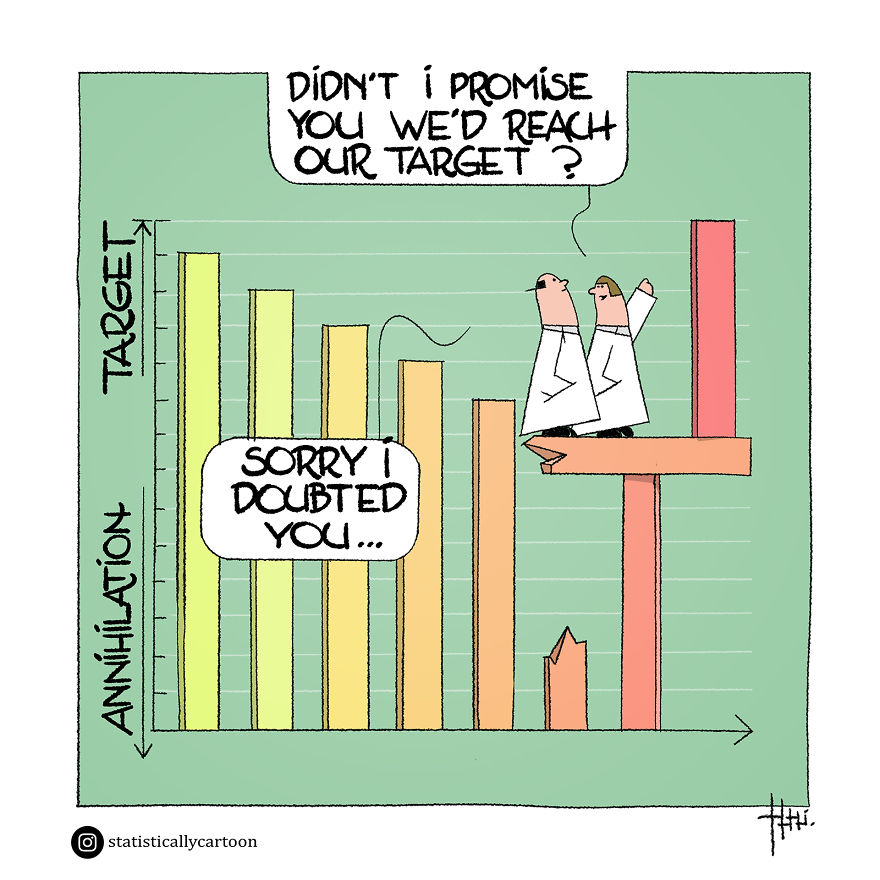
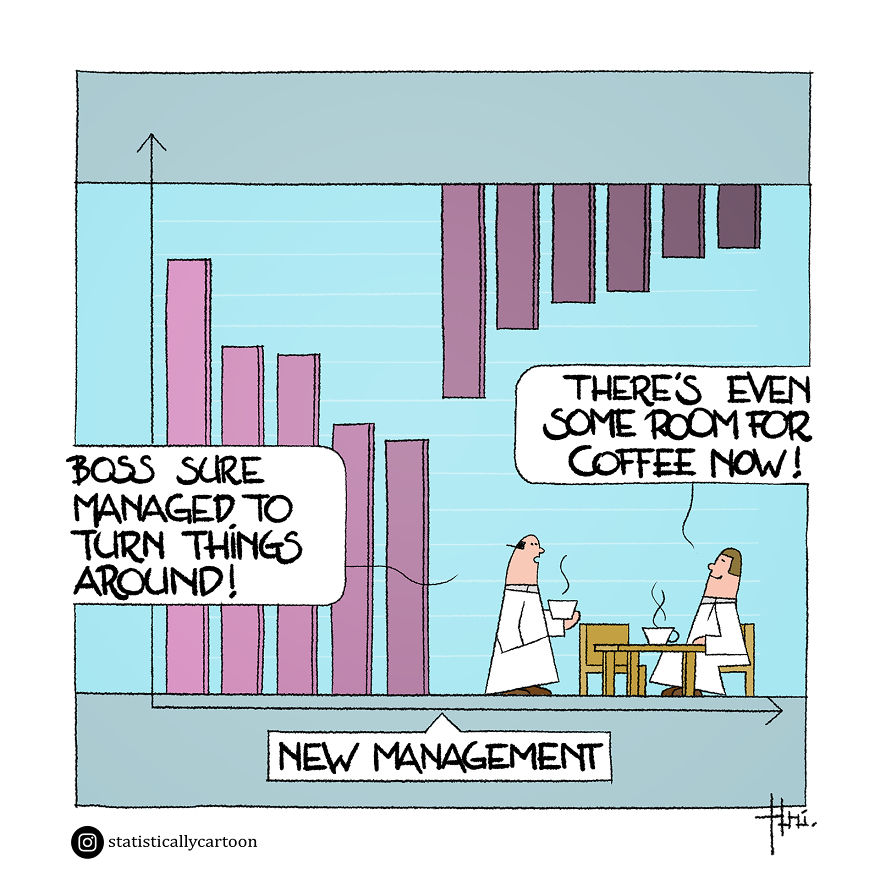
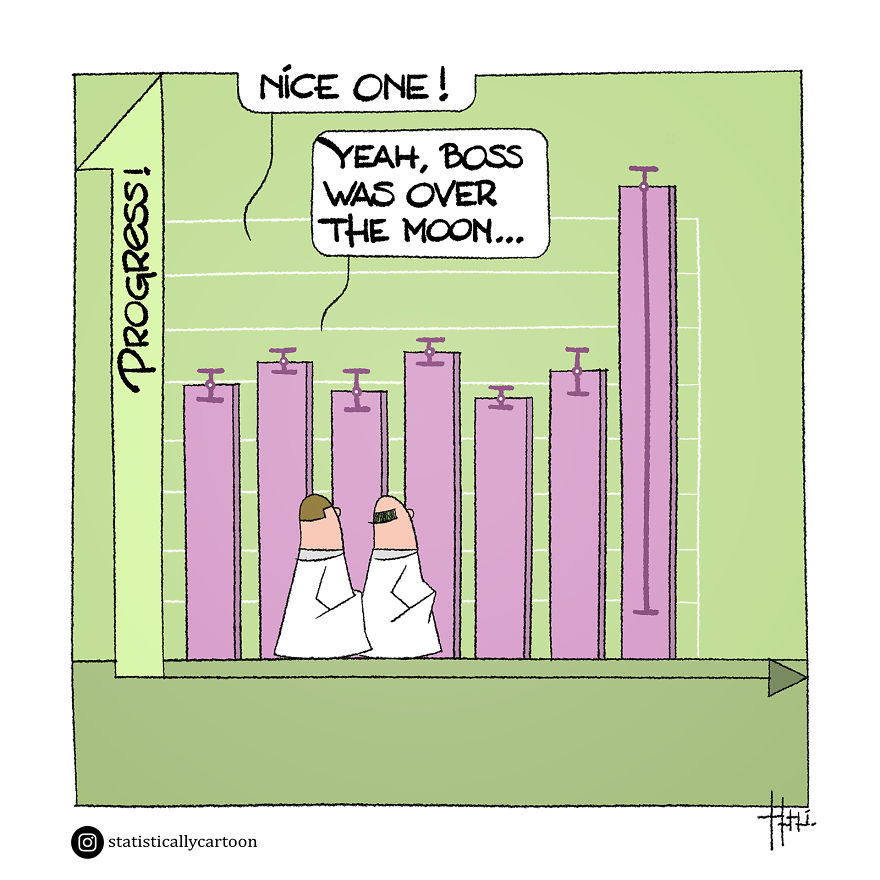
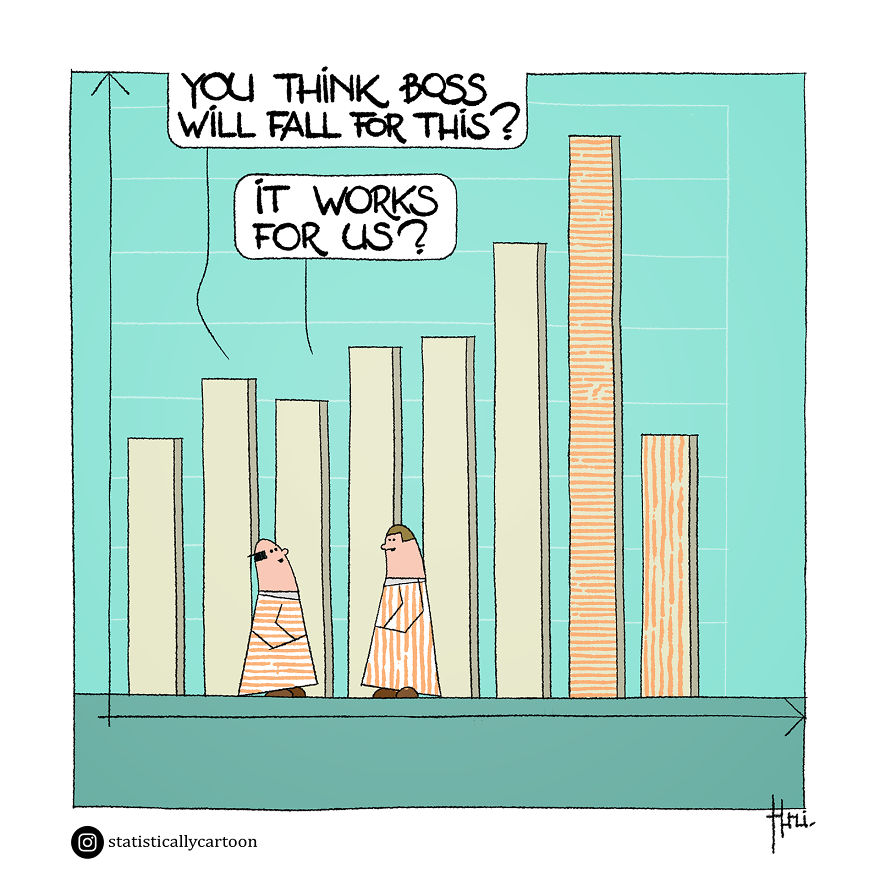
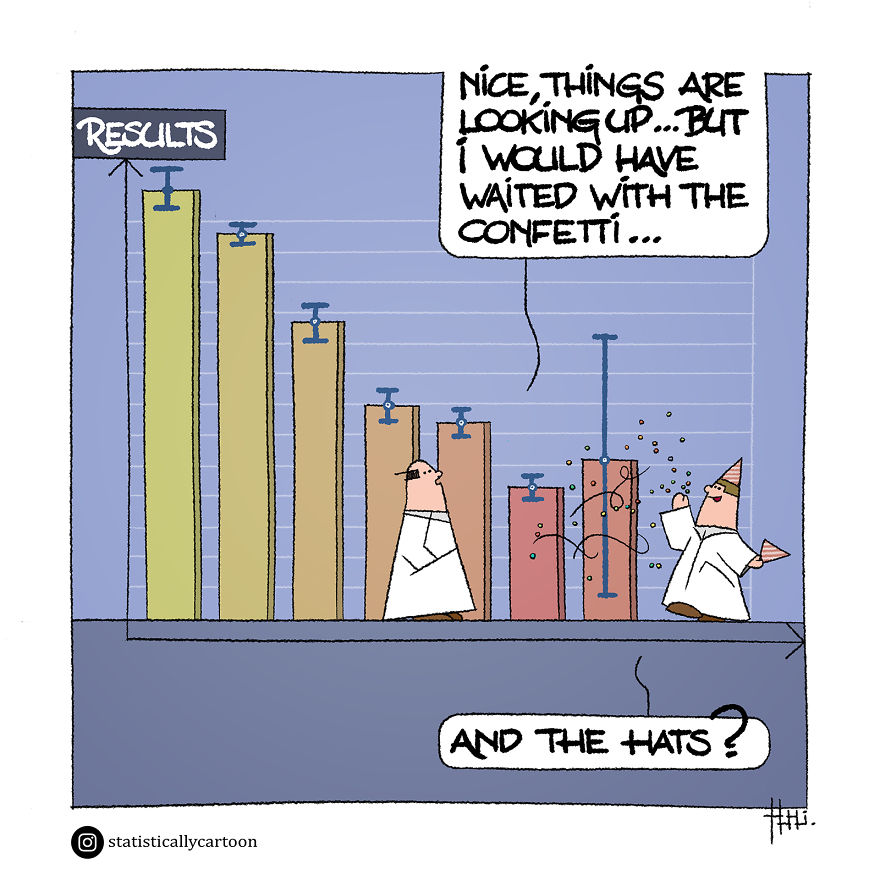
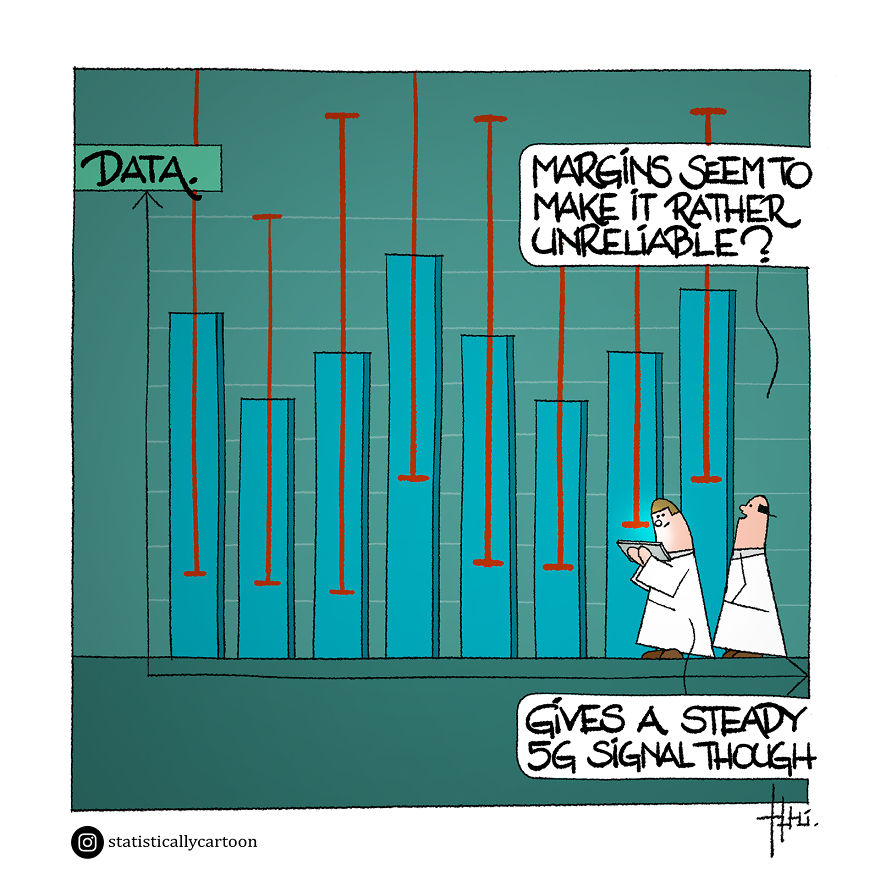
I love these and I have a serious question - why is the error bar on the last column not equally spread on either side of the data point? Why is the top bar shorter?
That is the joke. The last bar is essentially meaningless because of the large range of error, but the "boss" is happy about the supposed increase.
Load More Replies...Statistics show that the average person has one ball and one boob. Thats a fact!
These are really good, thank you! Old proverb: Don't trust a statistics that you didn't forge yourself.
Nice one. Can see a cartoon coming...
Load More Replies...Statistics show that the average person has one ball and one boob. Thats a fact!
These are really good, thank you! Old proverb: Don't trust a statistics that you didn't forge yourself.
Nice one. Can see a cartoon coming...
Load More Replies...
 Dark Mode

 No fees, cancel anytime


