ADVERTISEMENT
Article created by: Raf Schoenmaekers

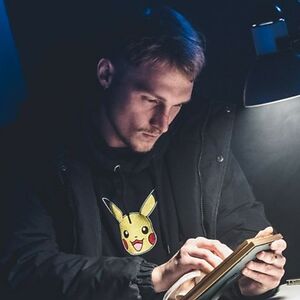
I'm a digital artist and visual developer, or vice versa, living in Belgium (Europe that is). Yet, I do like my analog pencil, not because I can draw (which I can't), but it allows me to think more freely. I wanted to draw comics when I was young, but then I became an engineer and ended up doing 3D animation and post-production. So I tend to do anything "visual" I like... like now, drawing cartoons again as I did 30 years ago.

In November 2019, I found my niche in statistics and them being (mostly) (ab)used in science, media, politics... And though I intended to steer clear from current affairs, a few months after I started the series, the earth was struck with Corona, media was flooded with statistics, and I couldn't help but touch upon the topic, gently. I do prefer the absurd and witty, however.

Not always succeeding, but plenty of ideas to keep trying. The top spot and a true master in that field? Tom Gauld, whose work I truly admire (and he can draw).

So here is my absurd cartoon series with the occasional glimpse of reality. I hope you enjoy it. And if you do, find out more on my Instagram.

More info: Instagram | Facebook

#1

Pie chart showing 1% and 99% with two people discussing accuracy, highlighting statistical comics about life.

Report

RELATED:
    #2

    Scientists in lab coats analyze a world map with large blue data bubbles in a statistical comics about life.

    Report

    #3

    Cartoon showing statistical comics about life with chocolate bar graph and chocolate pie chart by two scientists.

    Report

    #4

    Statistical comic showing two people on an IQ bell curve, one claiming to be highly gifted with humorous speech bubbles.

    Report

    ADVERTISEMENT
    #5

    Statistical comic depicting equality with varying bars being adjusted by scientists using books and equipment.

    Report

    ADVERTISEMENT
    #6

    Two people in a boat with a polar bear facing a large wave labeled climate change in a statistical comics style.

    Report

    #7

    Cartoon showing advanced statistics with cocktail glasses filled to full, half, and empty levels in a humorous statistical comics style.

    Report

    #8

    Venn diagram comic illustrating how statistics overlap between truth and lies, highlighting statistical humor about life.

    Report

    ADVERTISEMENT
    #9

    Cartoon showing two scientists with face shields playing paintball on a world map covered with green splatters, statistical comics.

    Report

    ADVERTISEMENT
    #10

    Two scientists on a diving board above a bar chart with labels target and annihilation in a statistical comics about life.

    Report

    #11

    Statistical comic showing a forklift stacking bars from smallest to biggest illustrating life and statistical humor.

    Report

    #12

    Two scientists in a statistical comic discussing correlation while connecting dots on a graph about life and data analysis.

    Report

    ADVERTISEMENT
    #13

    Statistical comic showing bar graph of tree sizes with scientists commenting on nature's strength versus humankind's impact.

    Report

    ADVERTISEMENT
    #14

    Cartoon about big data and statistical visualization with two scientists analyzing complex diagrams in a comic style.

    Report

    #15

    Statistical comics depicting workplace humor with charts and two characters discussing new management and coffee.

    Report

    #16

    Statistical comic showing a pizza chart with equal 12.5% slices and two characters discussing it.

    Report

    ADVERTISEMENT
    See Also on Bored Panda
    #17

    Two characters unveiling a rising bar graph with text about a promising forecast and champagne in a statistical comics style.

    Report

    ADVERTISEMENT
    See Also on Bored Panda
    #18

    Man walking a tightrope over a statistical bar chart, illustrating highs and lows in a humorous statistical comics about life.

    Report

    #19

    Statistical comic showing efficiency of Doric, Ionic, Corinthian, and modern columns with characters commenting.

    Report

    ADVERTISEMENT
    See Also on Bored Panda
    #20

    Cartoon showing a sales bar graph with two men discussing advertising and a large BUY MORE sign below the bars.

    Report

    #21

    Cartoon of two people in a Venn diagram, humorously discussing how much they have in common in statistical comics about life.

    Report

    ADVERTISEMENT
    See Also on Bored Panda
    #22

    Cartoon showing two men examining a hanging bar chart with NASDAQ labeled, illustrating a statistical comic about life insights.

    Report

    ADVERTISEMENT
    See Also on Bored Panda
    #23

    Statistical comic showing characters discussing p-value targets 0.05 and 0.01 in a formal hypothesis testing scenario.

    Report

    #24

    Statistical comic showing two people discussing correlation and causation with scatter plot and shooting stars.

    Report

    #25

    Two cartoon scientists examining a woven grid labeled space and time in a statistical comics about life.

    Report

    ADVERTISEMENT
    See Also on Bored Panda
    #26

    Statistical comic showing a bar graph with a couple hugging on the tallest bar and a message about enjoying life.

    Report

    ADVERTISEMENT
    See Also on Bored Panda
    #27

    Statistical comic showing two scientists altering results on a bar chart labeled with statistical comics about life.

    Report

    #28

    Cartoon showing statistical comics with a person approving uneven bar chart heights, highlighting life’s humorous statistics.

    Report

    ADVERTISEMENT
    ADVERTISEMENT