ADVERTISEMENT
Article created by: Anna Csekő

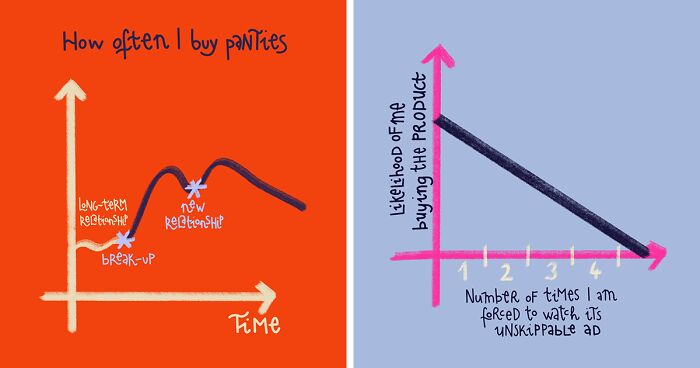
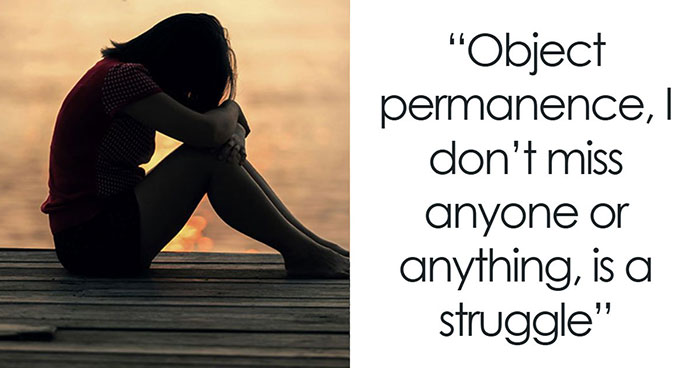
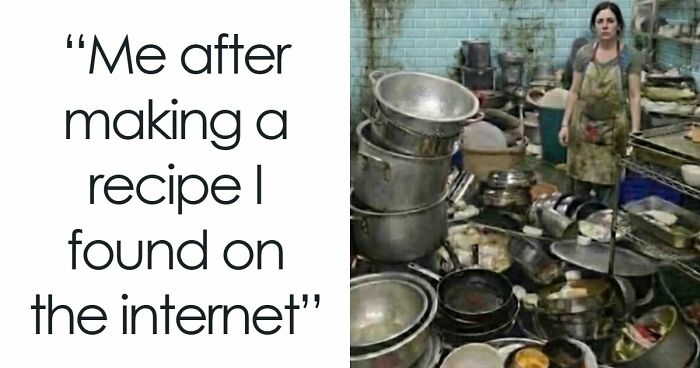
I started creating charts 1.5 years ago about my life when I felt I needed to let out some of the frustrations I had as a woman in her 30s. I thought it was a fun way to approach topics that many of us experience and I combined this with flashy colors that I have always been amazed by.

Most of the time I illustrate lighter themes such as dating in 2023 but sometimes I enjoy depicting more abstract ideas such as relationships and well-being with charts.

More info: Instagram

#1

Youtube Ads

Chart illustrating a negative correlation between number of forced unskippable ads and likelihood of buying the product.

Report

Fabrice Neyret
Community Member
7 months ago Created by potrace 1.15, written by Peter Selinger 2001-2017

sorry but your font is just not readable.

RELATED:
    #2

    Playgrounds vs. Hell

    Venn diagram illustrating relatable chart with kids, playgrounds, and hell fire overlapping at constant screaming.

    Report

    #3

    Adulting 3

    Chart showing how much of an adult one feels over years, a relatable chart illustrating adulthood experience.

    Report

    #4

    Adopting A Dog

    Hand-drawn relatable chart showing increasing joy and fur in the flat after getting a dog with playful colored arrows.

    Report

    ADVERTISEMENT
    #5

    Neighbor Watch

    Bar chart showing feeling of surveillance higher from annoying neighbor than tech giants in relatable charts.

    Report

    ADVERTISEMENT
    #6

    Small Acts Of Kindness

    Bar chart showing effort small acts of kindness take versus amount of joy they could bring, relatable chart illustration.

    Report

    #7

    Cute Dogs

    Bar chart illustrating cuteness level comparing my dog and every other dog, a relatable chart about common experiences.

    Report

    #8

    Payday

    Hand-drawn relatable chart showing job satisfaction over time with a spike on payday, illustrating common work experience.

    Report

    ADVERTISEMENT
    #9

    Fashion In Hungary

    Venn diagram showing relatable fashion trends between Hungarian women behind trends and fashionable Gen Z in 2022.

    Report

    ADVERTISEMENT
    #10

    Being Short On Concerts

    A relatable chart humorously showing reasons to be tall as a fun way to approach common topics.

    Report

    #11

    My Mom vs. Me

    Two relatable charts comparing time spent taking care of kids, work, and university versus taking care of a dog, work, and YOLO at age 30.

    Report

    #12

    "Cool"

    Chart illustrating changing levels of coolness with trends from hipsters to mainstream and old people, relatable charts concept.

    Report

    ADVERTISEMENT
    See Also on Bored Panda
    #13

    Modern Romance

    Mood chart with peaks labeled beep and it's not from him, illustrating relatable emotions in a fun way with charts.

    Report

    ADVERTISEMENT
    See Also on Bored Panda
    #14

    Adulting

    Relatable chart illustrating the cycle of being an adult: suffering and keeping on going in a simple design.

    Report

    #15

    Dating In 2023

    Pie chart illustrating relatable topics about guys in 2023, featuring sad vibes, memes, and not looking for anything serious.

    Report

    ADVERTISEMENT
    See Also on Bored Panda
    #16

    Dance Scenes

    Bar chart showing heat levels of the hottest dance scenes in film history with relatable chart style.

    Report

    #17

    Coffee Anxiety

    Line graph showing energy rising with number of coffees consumed, then fluctuating as panic kicks in, relatable chart humor.

    Report

    ADVERTISEMENT
    See Also on Bored Panda
    #18

    Relationships

    Hand-drawn relatable chart comparing emotional ups and downs in fresh relationship versus old relationship trends.

    Report

    ADVERTISEMENT
    See Also on Bored Panda
    #19

    The Surrealist Hungary

    Bar chart with surreal comparisons showing living in Hungary in 2022 feels more surreal than Kafka's The Castle or Dalí's paintings.

    Report

    #20

    Saturday Nights

    Graph showing mood on the dancefloor rising on Saturday night with peak when Spice Girls Wannabe starts playing, relatable chart.

    Report

    #21

    I Know You Do This Too

    Chart showing how often panties are bought over time during relationships, illustrating relatable patterns and funny trends.

    Report

    ADVERTISEMENT
    ADVERTISEMENT
    See Also on Bored Panda