ADVERTISEMENT
Article created by: Rugilė Žemaitytė

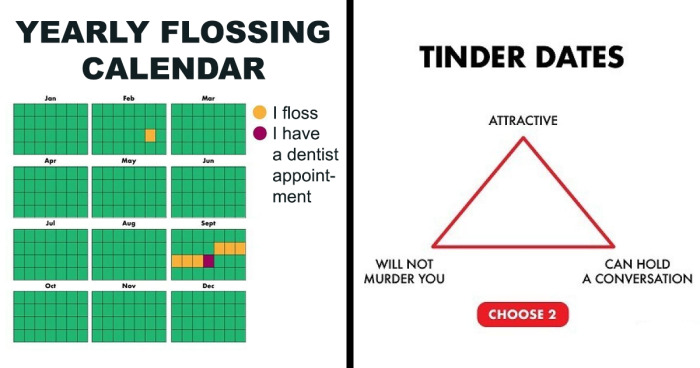
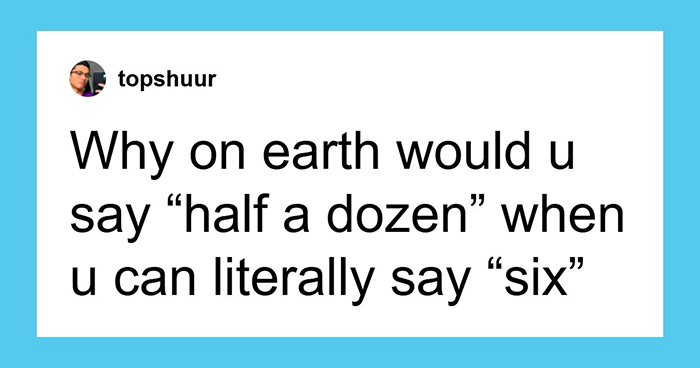
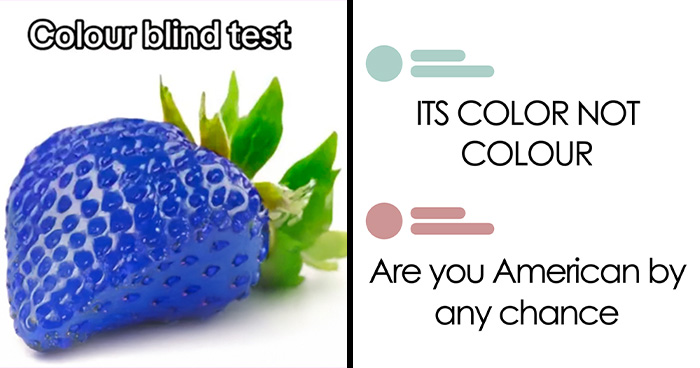
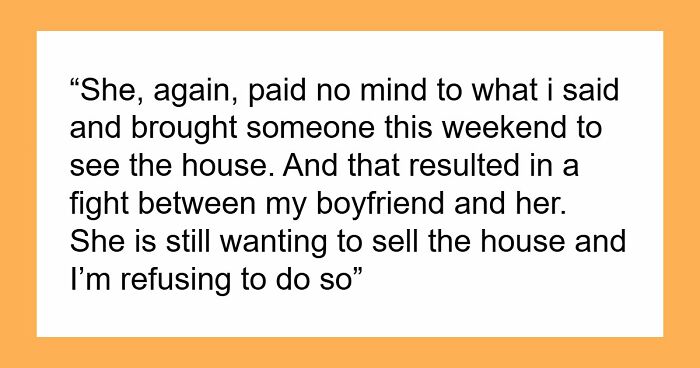
Charts and graphs are often associated with important data and boring presentations, or math lessons back in school, which were not equally fun for everyone. However, charts can be fun, and Matt Shirley, better known as Matt Charts, is here to prove it again.

The chart connoisseur never ceases to amaze his followers with amusing and oh so relatable content. His works cover everything from social anxiety to taxes, Tinder dates, dentist appointments, and so much more (the guy even managed to turn Rick Astley’s iconic song into a chart). Unsurprisingly, his insight in the form of colorful sketches has amassed over 419 thousand followers on Instagram, and quite a few here at Bored Panda as well. We’ve gathered some of his newest masterpieces on this list for you to enjoy, so wait no longer and scroll down to see for yourself that charts can indeed be fun.

More info: Instagram | MattShirleyCharts.com | Facebook | Twitter | Patreon

#1

Tag Someone Who Listens To Bad Music Loudly

Venn diagram showing no overlap between people who listen to good music and people who drive with windows down, funny chart.

mattsurelee Report

RELATED:
    #2

    I’m Looking For A Good Stew Recipe If Anyone Has One

    Pie charts showing expectation vs reality of online recipes with humor, illustrating funny charts from Matt Shirley.

    mattsurelee Report

    #3

    ☎️

    Funny chart showing phone call timeline with talking turns and wishing it went to voicemail, humorous charts by Matt Shirley.

    mattsurelee Report

    #4

    Tag A Bad Compliment Taker. I Tag Myself

    Pie chart titled taking a compliment showing humorous categories and funny charts by Matt Shirley.

    mattsurelee Report

    ADVERTISEMENT
    #5

    I Have A Dentist Appt

    Yearly flossing calendar chart with green, yellow, and purple squares humorously showing flossing habits and dentist appointments.

    mattsurelee Report

    ADVERTISEMENT
    #6

    Tag Someone Who Has Strong Opinions About Holding Doors

    Pie chart humorously showing reasons for holding the door for others, featuring funny charts by Matt Shirley.

    mattsurelee Report

    #7

    For My People Pleaser Friends

    Pie chart illustrating being a people pleaser with humor, featuring anxiety, confusion, and relaxation in funny charts.

    mattsurelee Report

    #8

    For Folks Who Had To Go Back To The Office 👖

    Bar chart humorously ranking the worst things about going back to the office, from sitting all day to not talking to oneself.

    mattsurelee Report

    ADVERTISEMENT
    #9

    Chip Cycle

    Funny chart showing the chip cycle: buy a bag of chips and finish the whole thing in one sitting, humor in charts.

    mattsurelee Report

    ADVERTISEMENT
    #10

    Drop Names Of Shows You’ve Given Up On Recently

    Funny streaming TV cycle chart illustrating watching popular shows, trying new ones, and giving up after two episodes.

    mattsurelee Report

    #11

    😎

    Humorous pie chart showing reasons for wearing sunglasses, illustrating a funny and honest take on everyday life charts.

    mattsurelee Report

    #12

    Should I Make A Part 2 On This?

    Humorous chart illustrating changes in body symptoms and traits over time with funny data trends and labels.

    mattsurelee Report

    ADVERTISEMENT
    See Also on Bored Panda
    #13

    Fruit ripeness chart showing stages from not ripe to too ripe for common fruits with colored symbols for easy tracking.

    mattsurelee Report

    ADVERTISEMENT
    See Also on Bored Panda
    #14

    A Few Days Late With This

    Calendar chart for April 2023 with colorful blocks illustrating funny and honest life moments in charts by Matt Shirley.

    mattsurelee Report

    #15

    Every Open Concept Office Ever

    Funny open concept office seating chart with humorous labels, showcasing honest and funny charts that sum up our lives.

    mattsurelee Report

    ADVERTISEMENT
    See Also on Bored Panda
    #16

    Topical

    Chart showing work pretended, work completed, drinks consumed, attention span, and joy levels on a Friday, from funny charts by Matt Shirley.

    mattsurelee Report

    #17

    A Little Holiday Chart I Made For @drizlyinc

    Humorous chart illustrating crowded grocery store aisles during holidays with funny life observations and labeled groups.

    mattsurelee Report

    ADVERTISEMENT
    ADVERTISEMENT
    See Also on Bored Panda