ADVERTISEMENT

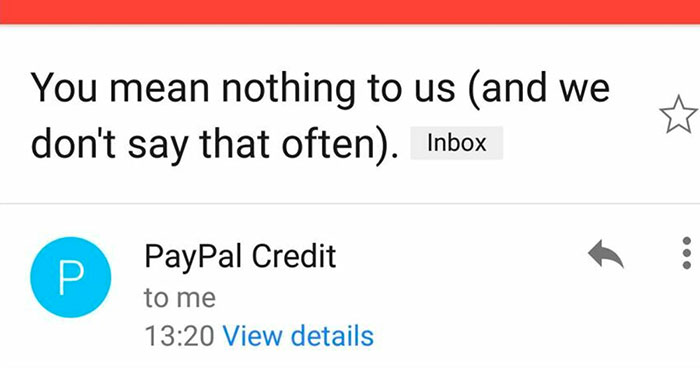
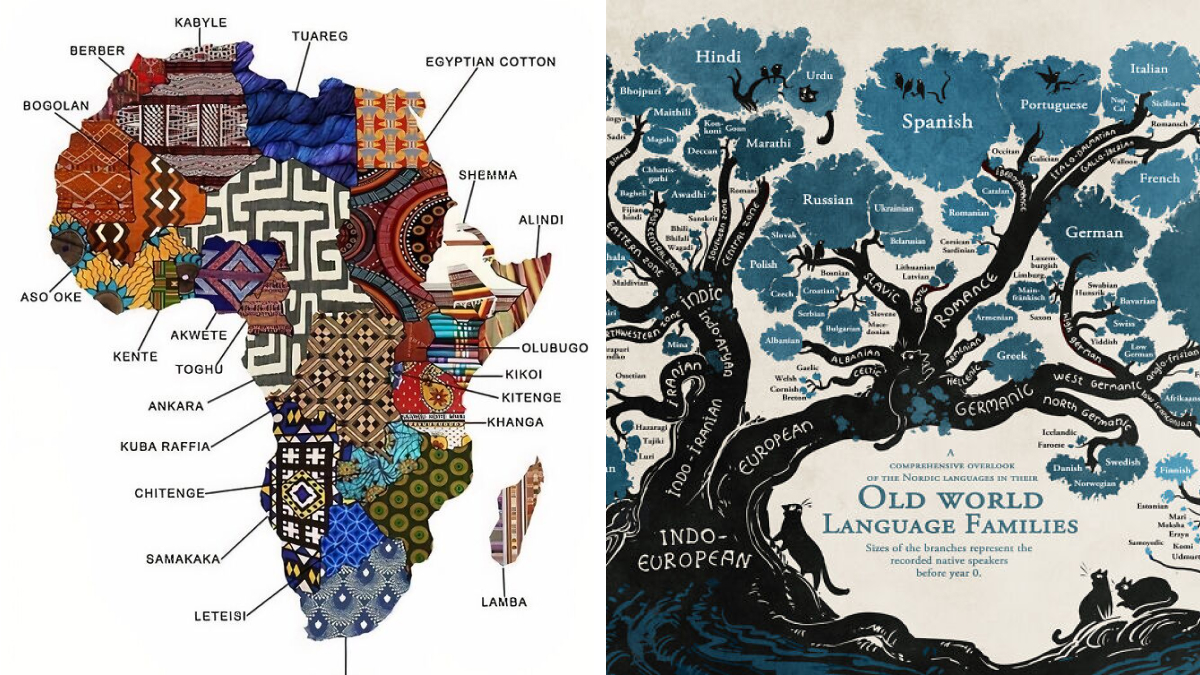
Remember when encyclopedias were our go-to source for world knowledge? If that's the case, it's time to take an ibuprofen for your back... Today's information explosion delivers fascinating facts at lightning speed, but often as overwhelming walls of text that our brains simply skim past. That's where these brilliant infographics come to the rescue. They transform complex information into visual stories our minds actually want to absorb.

Colors, shapes, and clever illustrations work together to make learning effortless and—dare we say it—genuinely fun! From showing how the alphabet evolved to visualizing how to find the best watermelon, these thirty masterfully designed infographics turn data into discovery. Each one distills information down to its most engaging essence, proving once again that a well-crafted image truly is worth a thousand words. Whether you're a visual learner or just appreciate smart design, these infographics reveal fascinating world facts in ways that simply stick with you.

#1

A Cool Guide To Pop vs. Actual Psychology

Infographic comparing pop psychology and actual psychology concepts like gaslighting and trauma.

Indigo_222 Report

RELATED:
    #3

    A Cool Guide Equality, Equity, And Justice: Breaking It Down Differently

    Infographic illustrating reality, equality, equity, and justice concepts with three people viewing a baseball game.

    Constant-Freedom Report

    Luke Branwen
    Community Member
    7 months ago Created by potrace 1.15, written by Peter Selinger 2001-2017

    "Reality" should be one person owning a full warehouse of boxes, guarded by armed forces, while digging a huge, deep moat around the stadium

    View more comments
    #4

    Hey Buddy

    Venn diagram showing phrases used when starting a fight, petting a dog, or consoling a child.

    abbs_trakt Report

    ADVERTISEMENT
    #5

    Language Family Tree

    Infographic illustrating the old world language families with a branching tree design.

    Stand Still. Stay Silent Report

    ADVERTISEMENT
    #6

    The Deadliest Hunters On Land (Based On Successful Kill Percentage)

    Infographic showing the deadliest land hunters by k**l percentage, with dragonflies leading at 95%.

    jpc4stro Report

    Trophy Husband
    Community Member
    7 months ago Created by potrace 1.15, written by Peter Selinger 2001-2017

    They aren't on land, they hung in the air...

    View more comments
    #7

    A Cool Guide To The Mythical Beasts Of Germany [oc]

    Infographic of mythical beasts in Germany, featuring various illustrated creatures on a detailed map.

    NeilParkinsonMakes Report

    #8

    A Cool Guide Showing The Lighthouses In The UK

    Map of the United Kingdom showing the locations of lighthouses, part of brilliantly designed infographics.

    AlephMartian Report

    Jay Scales
    Community Member
    7 months ago Created by potrace 1.15, written by Peter Selinger 2001-2017

    This would be a nice lowlight to have on the wall

    ADVERTISEMENT
    #9

    American Insulin Prices Are Off The Charts

    Infographic showing high American insulin prices compared to Japan, Canada, Germany, France, UK, Australia, and Turkey.

    Big_Maintenance_1789 Report

    Boris Long-Johnson
    Community Member
    7 months ago Created by potrace 1.15, written by Peter Selinger 2001-2017

    Assuming that’s price to the consumer. The info here isn’t correct for the UK. I’m assuming some researcher looked at the standard prescription charge in “the NHS” and got England, Scotland for example is free for all prescriptions on the NHS. In addition I believe in England you can buy a pass to make prescriptions free and those on benefits etc don’t pay either.

    View more comments
    ADVERTISEMENT
    #10

    Evolution Of The Alphabet

    Infographic illustrating the evolution of the alphabet from Proto-Sinaitic to modern Latin script.

    Heath-Relecovo Report

    LizzieBoredom
    Community Member
    7 months ago Created by potrace 1.15, written by Peter Selinger 2001-2017

    This really screws up iota before epsilon except after kappa.

    #11

    European Roads To Rome

    Intricate infographic design showing river networks forming a complex pattern for educational purposes.

    jmerlinb Report

    #12

    Venn Diagram Of Strippers/Cats

    Venn diagram humorously comparing strippers and cats, illustrating a shared trait.

    keith2301 Report

    RamiRudolph
    Community Member
    7 months ago Created by potrace 1.15, written by Peter Selinger 2001-2017

    Not true for cats, at least not for mine.

    ADVERTISEMENT
    #13

    Best Kind Of Street Lamps

    Infographic on light pollution from street lamps, showing different levels from unacceptable to best shielding for dark skies.

    FluxCrave Report

    Pernille
    Community Member
    7 months ago Created by potrace 1.15, written by Peter Selinger 2001-2017

    In all the villages , and a few towns, around where I live the street lights are off from 22.00 to 06.00h.

    View more comments
    ADVERTISEMENT
    #14

    A Cool Guide To Underground Aleut Homes (Barabara)

    Underground dwelling infographics, showcasing a cutaway design and labeled features for educational purposes.

    colapepsikinnie Report

    #15

    We Could Fund Us…

    Infographic on U.S. 2022 military budget allocation alternatives, highlighting potential spending on education and healthcare.

    sillychillly Report

    Luke Branwen
    Community Member
    7 months ago Created by potrace 1.15, written by Peter Selinger 2001-2017

    But with all that useless stuff above, who's gonna do REALLY NECESSARY things, like killing brown people, uprooting their governments, and stealing their oil, HUUUUH??? /s

    View more comments
    #16

    Is It A Crime To Knock On A Door And Run Away?

    Infographic showing if door-knocking and running is a crime in Europe; green is no, red is yes for Britain.

    geo.facts_ Report

    ADVERTISEMENT
    See Also on Bored Panda
    #17

    Friend: "You Can't Make Genetics Easy To Understand In Just One Image". Me:

    Infographic of gummy bears arranged in a family tree, teaching genetics concepts through candy visuals.

    4reddityo Report

    ADVERTISEMENT
    See Also on Bored Panda
    #18

    Geography Terms

    Illustrated geography terms infographic with landforms and features like mountains, deserts, rivers, and coastlines.

    MrJones- Report

    #19

    Power Socket Type Guide

    Infographic showing different power socket types across European countries with color-coded regions.

    informationtiger Report

    Ace
    Community Member
    7 months ago Created by potrace 1.15, written by Peter Selinger 2001-2017

    Blue and green are cross-compatible, Orange is largely being replaced by green. Red is annoying for my guests.

    View more comments
    ADVERTISEMENT
    See Also on Bored Panda
    #20

    Places Where Birthright Citizenship Is Based On Land And Places Where It Is Based On Blood

    Infographic illustrating citizenship rules: land-based (blue) vs. blood-based (red) countries worldwide.

    india.in.pixels Report

    Zero Costa
    Community Member
    7 months ago Created by potrace 1.15, written by Peter Selinger 2001-2017

    oh I had no idea Australia was rule of blood

    #21

    The Planets To Scale

    Infographic of planets to scale with colorful circles, illustrating relative sizes of the solar system planets.

    hsuboi Report

    ADVERTISEMENT
    See Also on Bored Panda
    #22

    What Do You Use Most?

    Infographic comparing transportation efficiency: one train, 15 buses, 625 cars for 1,000 people.

    Gallits Report

    Ace
    Community Member
    7 months ago Created by potrace 1.15, written by Peter Selinger 2001-2017

    What the hell sort of train gets 250 people in each carriage?

    View more comments
    ADVERTISEMENT
    See Also on Bored Panda
    #23

    If Only We Could Get One For Avocados

    Infographic on choosing the perfect watermelon, highlighting size, shape, field spots, and webbing for best flavor.

    R3333PO2T Report

    #24

    Decline Of Faith Amongst Young American Adults

    Infographic showing trends in religious beliefs among young adults from 1990 to 2020, highlighting shifts in theism and atheism.

    reddit.com Report

    FreeTheUnicorn
    Community Member
    7 months ago Created by potrace 1.15, written by Peter Selinger 2001-2017

    What is the difference between believing in a higher power and a god?

    View more comments
    #25

    U.S. Flag But Each Star Is Scaled Proportionally To Their State’s Population, In Roughly It’s Geographical Position

    Stylized American flag design infographic with scattered stars.

    jmerlinb Report

    ADVERTISEMENT
    See Also on Bored Panda
    #26

    The Average Cost Of Insulin By Country

    Infographic comparing global insulin prices, highlighting the disparity in costs by country.

    jpc4stro Report

    ADVERTISEMENT
    See Also on Bored Panda
    #27

    Measure System In The United States And In The Rest Of The World

    Infographic comparing US and international measurement systems, featuring Fahrenheit vs. Celsius scales and unit conversions.

    rdfporcazzo Report

    Ace
    Community Member
    7 months ago Created by potrace 1.15, written by Peter Selinger 2001-2017

    Fails to take into consideration the UK which still uses some of the imperial measures as well, and parts of Europe where some standard measures (plumbing, for example) are still defined in inches.

    #28

    Long Exposure Of A Roomba Vacuum With A Color Changing Light On Top

    Colorful light patterns on a bedroom floor, creating an artistic visual effect.

    zoliva Report

    Lee Gilliland
    Community Member
    Premium
    7 months ago (edited) Created by potrace 1.15, written by Peter Selinger 2001-2017

    I'm seeing an awful lot of unvaccumed carpet here.

    View more comments
    #29

    Different Electrical Outlets Per Countries

    Various international power sockets and plugs displayed with corresponding country flags for educational infographics.

    jeff_tatum Report

    Tucker Cahooter
    Community Member
    7 months ago Created by potrace 1.15, written by Peter Selinger 2001-2017

    No wonder Denmark scores highly in the happiest countries list. Even their electrical outlets look happy

    View more comments
    ADVERTISEMENT
    #30

    Pre-Trip Checklist

    Infographic of a pre-trip checklist including tasks like pet care, unplugging appliances, and car maintenance.

    Bonboniru Report

    Tucker Cahooter
    Community Member
    7 months ago Created by potrace 1.15, written by Peter Selinger 2001-2017

    Seems a bit of overkill for a trip to the local supermarket

    View more comments
    ADVERTISEMENT