Get Premium
Dark mode theme is available exclusively for premium users. Learn more about the benefits of subscribing.
No fees, cancel anytime.

 Dark Mode Ad-Free Browsing Unlimited Content
 Ad-Free Browsing Unlimited Content Dark Mode
Join 1.2 million Panda readers who get the best art, memes, and fun stories every week!
2020 has been quite a wild year. And while the coronavirus pandemic has been the main focus and reason behind this wildness, it wasn’t the only thing that happened and was a point of conversation this year.
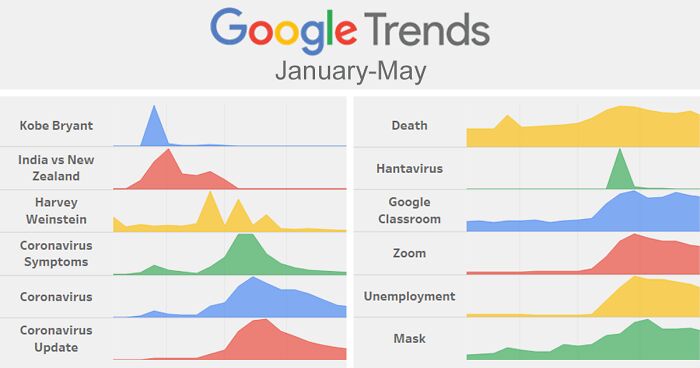
Roshaan Khan, with whom Bored Panda got in touch and whom you can find on LinkedIn here, compiled an insightful infographic based on Google Trends that provides a retrospective of some of the most notable things that happened this year. And while some entries look like they happened so long ago, others, like the coronavirus, were a constant and still feel like a very fresh deal.
Image credits: Roshaan Khan
Now, a couple of things to note before we dive into the meat of things. Even though these are global trends, many of them pertain mostly to the US and to some extent India, as it’s all based and filtered out by top search results.
Also, when this graph first popped up on Reddit, the commenters noted that the data relates to itself, but it is definitely based on absolute numbers—just that Google itself doesn’t release those numbers.
“So, basically, when Google released their Year in Search list, all the data was publicly available for download from their lists. It provides the top 10 search terms generally, regardless of category. Then it also has the top 10 terms for categories such as news, people, actors, TV shows, concerts etc,” elaborated Khan. I wanted this visualization (viz) to not only reflect the top terms but also represent what the year 2020, as in if people were to look back on this viz five years from now, would it capture the events that defined the year?”
He continued: “That was my guiding metric and as such I chose to not only show the top 10 general search terms but also include the top terms for news events and people, because these 3 categories can act as the pulse of culture—and I believe from the massive attention they got, people agreed. Once I got the results, I used Tableau to visualize them all in this Ridgeline plot. I’m a specialist in Tableau so it’s always been my go-to visualization software. A Ridgeline plot is where you have multiple measures that are shown across a similar timeline or distribution.”
Image credits: Roshaan Khan
So, the graph is set up in chronological order, listing search terms from top to bottom, sorted by month from left to right.
The year started off with a spike in Kobe Bryant searches, following his tragic death, then moving on to India VS New Zealand, who were competing in the World Test Cricket Championship, and finally Harvey Weinstein, who was convicted of sexual assault charges in late February.
March came around and so did the coronavirus. The pandemic started sweeping the world and so search terms like coronavirus, coronavirus symptoms, coronavirus update, and death started trending. Then there was also the hantavirus scare, but it left as fast as it came around.
Now, the pandemic as a conceptual set of keywords left the top search spots, but it was everything else that was related to it that followed: Google Classroom and Zoom for distant teaching and meeting, worries about unemployment, the stimulus check, and, of course, masks.
This was also around the time the world had gotten used to the pandemic and moved on to other things, starting with George Floyd and the BLM movement. If things weren’t bad enough, theBeirut explosion also happened soon after, sending a shockwave of reaction throughout the entire world.
Image credits: Roshaan Khan
Come the end of the year and it all looks quite normal. Tesla stocks, TikTok, Indian Premier League, 4 months of election season googling (Joe Biden, Donald Trump, and U.S. Election Results), and then, ending the year, talks of a coronavirus vaccine started rising.
Now, these are just a few keywords that were trending, but Google has also provided top 10 lists of a handful of search categories, two of which, general searches and news, were dominated by coronavirus.
Tom Hanks was top searched actor, Ryan Newman was top searched athlete, Parasite was top searched movie, Among Us was top searched game, Tiger King was top searched TV show, and Joe Biden was top searched person.
Image credits: Roshaan Khan
And these are besides all of the other significant events of the year that apparently didn’t make it into any list, like the Australian wildfires, Hong Kong protests, Prince Harry and Meghan Markle’s announcement that they are stepping down, murder hornets, and many more.
“The data is for the top search terms, news terms and people terms for the whole world. Many people kept asking about certain events such as wildfires, Bitcoin and PS5. But what they didn’t know is that Google makes one list for global data and then separate, individual lists for country data. So, the wildfires were definitely trending in Australia on a country, but not a global level. Same goes for PS5, it was only in the US, not in the world. I think everyone had this assumption because the global news outlets kept reporting on them, but searches and news reporting are very different.”
The chart went viral on Reddit, garnering nearly 80,000 upvotes with over 2,500 comments and over a hundred Reddit awards. It also found its way on to LinkedIn and even Instagram. Though many were spouting jokes about all of the interesting correlations that can be drawn from this, overall most agreed that it has been a pretty crappy year. If it wasn’t obvious at this point.
Image credits: Roshaan Khan
One Redditor pointed out that the lines for Zoom and Google Classroom seem to correlate with the first and second wave of the pandemic, so we asked Khan whether he had a chance to look into it and see if there’s an actual correlation there:
“I didn’t get a chance to look at that as of now, because honestly this visualization became viral so fast, I really was still processing this whole thing. I mean, I never anticipated that it would become the big but I certainly found such statistical suggestions to be valuable. However, another reason why it might not be too ideal to do it is because it’s quite obvious that they would be correlated. I mean most of the subsequent searches after COVID, such as zoom, classroom, unemployment, vaccine, mask etc, occurred due to COVID, even stimulus checks. So those Redditors should understand that asking about this correlation is similar to, but not exactly the same, as asking if hunger and food are correlated. Plus correlation is not causation, so even finding a correlation wouldn’t tell much beyond confirming what we have expected.”
Image credits: Roshaan Khan
As mentioned previously, this was surprising to Khan. Khan’s a Data Analyst and Analytics Consultant who has published many of his Tableau projects on LinkedIn and they would often receive a lot of internet attention. And then he heard about r/DataIsBeautiful, a subreddit dedicated to all things data and diagrams.
“I decided to join and share my work there too. Literally, I had absolutely no idea that this particular viz would go so viral. I was shocked. I spent the better half of a day just reading every comment posted on it and the feedback from it. I just could barely process that so many people liked it and commented on the trends, and I was just really flattered to see that my work could be part of a larger community.”
He continued: “For me, my data philosophy has always been to just deliver something that is insightful for someone, so that they can learn something from my viz. Even as we speak, I’m finding that dozens of people on LinkedIn are resharing my post, and even I’m finding it on Instagram now as well— I’m not even on Instagram but my friend had shared that it’s reached their too with data pages sharing to their followers. So it’s really overwhelming but I’m really humbled by it.”
Image credits: Roshaan Khan
What are your thoughts on this? What are some positive things that happened during this otherwise not-so-good year? Let us know in the comment section below!
35Kviews
Share on Facebook
I think that I was responsible for a significant portion of the election result searches. I also think I cannot wait for this hellhole of a year to leave us.
Forgot wildfires, both Australia and the US (north)west. They could also include air quality for some more doom and gloom.
i live a good 20 miles away from the CA fires and in 2019 school was let out early the air was so bad. this year walking across the street meant holding my breath and running. That's how bad.
Load More Replies...I think that I was responsible for a significant portion of the election result searches. I also think I cannot wait for this hellhole of a year to leave us.
Forgot wildfires, both Australia and the US (north)west. They could also include air quality for some more doom and gloom.
i live a good 20 miles away from the CA fires and in 2019 school was let out early the air was so bad. this year walking across the street meant holding my breath and running. That's how bad.
Load More Replies...


 No fees, cancel anytime


93
17