Get Premium
Dark mode theme is available exclusively for premium users. Learn more about the benefits of subscribing.
No fees, cancel anytime.

 Dark Mode Ad-Free Browsing Unlimited Content
 Ad-Free Browsing Unlimited Content Dark Mode
Join 1.2 million Panda readers who get the best art, memes, and fun stories every week!
The New Year is the peak era of eating healthier, mindful consumption, and the frantic pursuit of that goal body.
We’ve all had those days where dinner looks suspiciously like the viral “savory girl dinner” bowl, which is a chaotic mix of crackers, cheese, jalapeños, and whatever else is in the fridge.
But while that bowl is a trendy choice for the privileged sections of the world, for billions of others, the luxury of choice simply doesn’t exist.
A groundbreaking report from the Global Diet Quality Project is now shifting the narrative on what actually needs to be on your plate to stay alive and healthy.
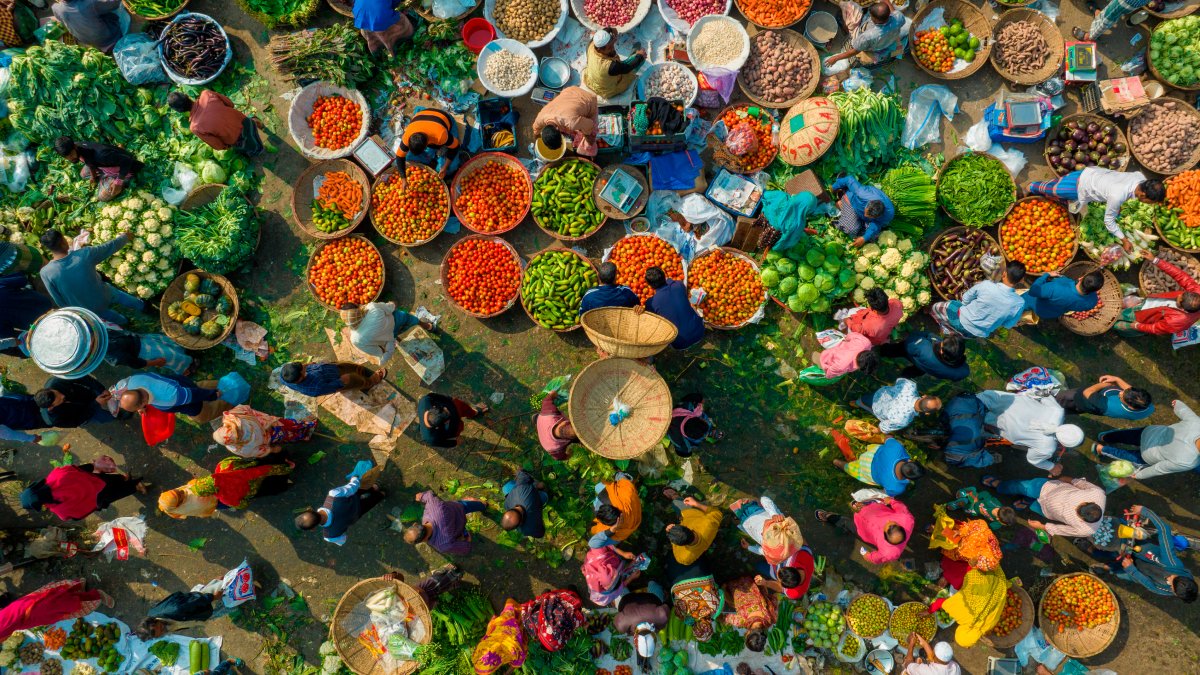
We’ve compiled a list of 15 countries with the worst diets. These are nations where the majority of the population fails to hit the All-5 food groups standard within a 24-hour window.
This isn’t just about eating your greens. This study has led researchers to uncover gruesome truths about global dietary habits and how the brutal intersection of poverty and lack of accessibility dictates what entire populations consume.
From European giants struggling with the dangerous overconsumption of sugar to nations where a single piece of fresh fruit is considered a luxury, these rankings prove that a full stomach doesn’t always mean a healthy one.

To create this list, we used the 2022 Global Diet Quality Project (GDQP) Full Report and its updated dataset. Unlike other rankings that consider only calories, this study uses the All-5 indicator to rank the 15 countries with the worst diets.
So how does one pass the All-5 test? In the All-5 test, a person must have consumed at least one food from each of these five categories in the previous 24 hours:
Note: The expanded 2024 dataset identifies Ethiopia as having the lowest All-5 score globally, at just 9%. However, this list is based on the harmonized 2021 - 2022 dataset used in the full GDQP report, which ensures consistent, comparable methodology across all countries. Ethiopia's 2024 figure comes from a separate data collection round and is referenced at the end of this article for context.
We have also cross-referenced these with Minimum Dietary Diversity for Women (MDD-W) and Unhealthy Food Consumption (UFC) scores to provide a full 360-degree view of global nutritional health. The MDD-W is a specialized proxy indicator.
This is because women of reproductive age have specific and intense micronutrient needs; this score indicates whether the most vulnerable members of a population are meeting at least 5 of 10 essential food groups. If the MDD-W is low, the nation's future health is at risk.
The UFC, on the other hand, is the junk food tracker. It measures the intake of sugar-sweetened beverages, ultra-processed snacks, and deep-fried foods.
In many of the countries on our list, we see a tragic transition where people are moving away from traditional, nutritious foods and toward cheap, calorie-dense junk food that leads to illness in the long run.
This post may include affiliate links.
A mere 21% of adults in the African country of Benin meet the All-5 benchmark.
The MDD-W is 42%, meaning over half of women in the country are not meeting the minimum dietary diversity needed for health.
Benin has one of the lowest rates of animal-source food consumption in West Africa, with many families relying on pulses and starchy staple foods. Interestingly, they have incredibly low levels of junk food and sugary beverage intake.
According to the official report, only a mere 27% of adults in the Lao PDR consume all five core healthy food groups daily.
Interestingly, the MDD-W is 73%. This is an indication that while a majority of women manage to achieve the minimum diversity of 5 groups, the broader population struggles to consistently include all five specific healthy categories of starchy staples, fruits, vegetables, pulses/nuts, and animal protein on a daily basis.
NCD-Risk is significantly higher among women in the Lao PDR. They also have a shocking Unhealthy Food Consumption (UFC) of 57%, with the report identifying a high reliance on starchy staples and incredibly low consumption of dairy and pulses.
Only 26% of adults in Lebanon meet the All-5 diversity benchmark.
Their MDD-W score is comparatively better at 56%, but their Protective Food Consumption (PFC) score is low at 49%. Lebanon also has shockingly low consumption percentages of Vitamin A-rich orange vegetables and fruits.
Once a torchbearer of the popular Mediterranean diet, recent data show a pattern in which high-quality proteins and fresh fruits are being replaced by cheaper, processed foods, such as sweet beverages, which are consumed at 79%.
Only 26% of Cameroonians consume all five healthy food groups every day.
They have an MDD-W score of 52% and an incredibly low PFC intake of 37%. Their UFC is at a questionable 46%.
Cameroon residents face a high rate of hidden hunger, in which their caloric intake is sufficient, but micronutrient density is low. Like many others on this list, their diet is dominated by starchy roots and tubers. While the carbs do provide energy, they lack the essential proteins found in dairy products and Vitamin A-rich foods.
An unexpected addition to this list is Russia, where only 23% of adults consume all five healthy groups, a surprisingly low figure for a European nation.
They have a high MDD-W score of 72% with the UFC rate at a dangerous 83%.
While dairy consumption is high, they have a relatively low intake of fruits and vegetables rich in Vitamin A. Russia’s low score is driven by a heavy reliance on starchy staples like potatoes and bread, as well as notable overconsumption of sugary drinks and other beverages.
Only 25% of adults in Kazakhstan meet the All-5 dietary diversity goal.
Their MDD-W score is soaring at 88%. The NCD-Protect score is notably lower here than in other countries.
Despite relative wealth, the widespread availability of cheap, processed snacks means people are replacing nutritious, traditional foods with convenience options, increasing their long-term risk of chronic disease.
Despite being a middle-income nation, the diet is brimming with meat and dairy products. While they have the wealth to avoid starvation, their 81% rate of unhealthy food consumption shows they are trading traditional nutrition for processed convenience.
Only 24% of adults in Gabon meet the daily All-5 recommendation.
They have a low MDD-W score of 56% and a severely high UFC of 61%. Like other nations, they have a high consumption of starchy staple foods and a low intake of vitamin A-rich fruits and vegetables.
54% of the residents in Gabon consume more than one sugary food or beverage, but conversely, a very low percentage consume fast food or instant noodles
23% of adults in Nigeria eat all five healthy groups daily.
They have a pretty low MDD-W score of 48%, with a UFC rate of 50%. Nigerians consume very few eggs, fruit, and dairy, relying heavily on starchy staple foods.
The NCD-Risk score has climbed to 2.0, indicating that while diversity is low, the intake of unhealthy foods is on the rise. Especially salty or fried snacks and sugary beverages. The Healthy Diet Pattern for the prevention of chronic disease is at just 9%.
Only 23% of Pakistan’s population reaches the All-5 diversity benchmark.
They have a significantly moderate MDD-W score of 54%. Pakistanis have a high consumption of sweet beverages at 89%.
While pulse consumption is high, the overall score is dragged down by a critical lack of intake of fresh fruit and a diverse range of vegetables.
They have a very low NCD-Risk score of 1.4, which means they aren’t eating much junk food, but their NCD-Protect score is also dangerously low at 3.2.
22% of adults in Bangladesh consume all five core healthy groups.
The MDD-W is 59%, which is higher than its neighbors; however, its fruit consumption rate remains among the lowest in Asia. It’s important to note that they have sufficient consumption of meat, poultry, and fish, as well as vegetables.
The Bangladeshi diet is highly cereal-dependent. The consumption of starchy staple foods accounts for the vast majority of caloric intake, leaving little room for micronutrients found in other food sources.
21% of adults in Cambodia eat a balanced diet consisting of the All-5, one of the lowest recorded in Southeast Asia, according to the harmonized report.
The MDD-W is relatively better at 66%. We also recognize a consistent pattern where many of these countries have very high consumption rates of starchy staple foods.
The NCD-Risk score is 1.8, as instant noodles and salty snacks increasingly replace traditional, nutritious food like fish and vegetables. The report also identifies a low consumption of pulses, nuts, or seeds, and dairy.
Only an alarming 20% of adults in Ghana meet the daily All-5 recommendation.
The MDD-W is low at 44%, showing that while some diversity exists, the overall population’s diet remains dangerously narrow. Their consumption of dairy and vitamin A-rich foods remains dangerously low.
Ghana is seeing a surge in unhealthy consumption, with over 40% of adults now regularly consuming sugar-sweetened beverages or fried snacks.
A devastating 19% of the population in Tanzania consumes the five core healthy food groups.
They also have a very low MDD-W at 36%. Previous pilots suggested higher diversity, but updated data show a collapse to 19%, making it one of the least diverse diets in East Africa.
18% of Tanzanians report eating zero vegetables or fruits on a typical day. Sweet beverage consumption remains high, while fruits, vegetables, and eggs take a serious hit in their diets.
Only 19% of adults in Sierra Leone achieve the All-5 healthy food group goal.
The MDD-W for women is only 39%, indicating a severe micronutrient inadequacy in the female population.
Diets here are overwhelmingly dominated by rice and other starchy staples, with one of the lowest NCD-Protect scores in the dataset. People in Sierra Leone are missing out on the benefits of nuts, seeds, whole grains, eggs, and dairy.
Only 16% of the population in Burkina Faso meets the All-5 requirement, the lowest in the harmonized 2021-2022 dataset. They are also among the poorest countries in the world.
They also have a low MDD-W score of 39%. Despite the lack of diversity, the country has a very low NCD-Risk score of 1.0, meaning very few ultra-processed foods are consumed. Their consumption of Eggs, Dairy, and fruits is also incredibly low.
While Burkina Faso held the worst diet title in the pilot report, the expanded 2024 dataset has uncovered a country in a more dire state: Ethiopia, which now holds the global record with an All-5 score of just 9%.
What is the unhealthiest country in the world?
Unhealthiness can be measured in multiple ways and is subjective, depending on the study and the metrics used.
According to the Mexico Bariatric Center, the Czech Republic often ranks among the top on global lists of unhealthy lifestyles. This is due to some of the highest alcohol consumption and tobacco use rates in the world.
However, when considering only dietary diversity, Ethiopia currently holds the record for the least diverse diet, with only 9% of the population meeting basic nutrition requirements.
Which country eats the most junk food?
A surprise to none, the United States and the United Kingdom are currently neck-and-neck for this title. Both nations consume ultra-processed foods (UPF), which account for 57% to 58% of their total daily calorie intake (via The Guardian).
According to The World Population Review, the US and UK fast-food markets generated $799.85 million and $164.40 million in annual revenue, respectively, in 2023, figures that reflect the sheer scale of the industry in both countries, even if they do not directly measure individual consumption rates.
Why is the US diet so unhealthy?
The Standard American Diet (SAD) is primarily rooted in convenience and industrialization. High-fructose corn syrup, refined grains, and sodium-heavy preservatives are far cheaper and more accessible than fresh produce in many food items. Research also shows that 9 out of 10 Americans do not reach the minimum recommended intake of vegetables (via American Heart Association).
What is the most unhealthy food?
The unhealthiest food in the world is subjective, like most trends on this list. However, highly processed foods, particularly meat like hot dogs and bacon, are considered among the unhealthiest foods in the world.
Other top offenders in many rankings also include sugar-sweetened beverages like sodas and foods high in trans fats, which have no known health benefits and are directly linked to heart disease (via BHF).
This article utilizes data from the Global Diet Quality Project.
Global Diet Quality Project. 2024. “DQQ Results Dataset 2021–2024.” Harvard Dataverse. Accessed at dietquality.org on January 4, 2026.
I can't help but think that these countries top the list due to a lack of access to diverse foodstuffs, rather than through choice. If you rank the countries with the worst diets where access to food is not a problem, I bet the UK and USA are right up there.
I came here to say this, and I agree that it seems that most of these countries are not choosing to eat "unhealthily" due to a lack of foodstuffs, but from necessity and financial hardship. It keeps them strong and alive, and many of the countries on this list tend to have little to no obesity overall. Now, the U.S...
Load More Replies...Vegans in developed countries are able to eat healthy and get everything they need from their diet, but they'd fail to meet these requirements.


 No fees, cancel anytime