Get Premium
Dark mode theme is available exclusively for premium users. Learn more about the benefits of subscribing.
No fees, cancel anytime.

 Dark Mode Ad-Free Browsing Unlimited Content
 Ad-Free Browsing Unlimited Content Dark Mode
Join 1.2 million Panda readers who get the best art, memes, and fun stories every week!

Data analysts are a true gem in society. They gather data that’s available for all of us to see and compare. After all, humans are naturally curious, and we all love learning more and more about the world around us.
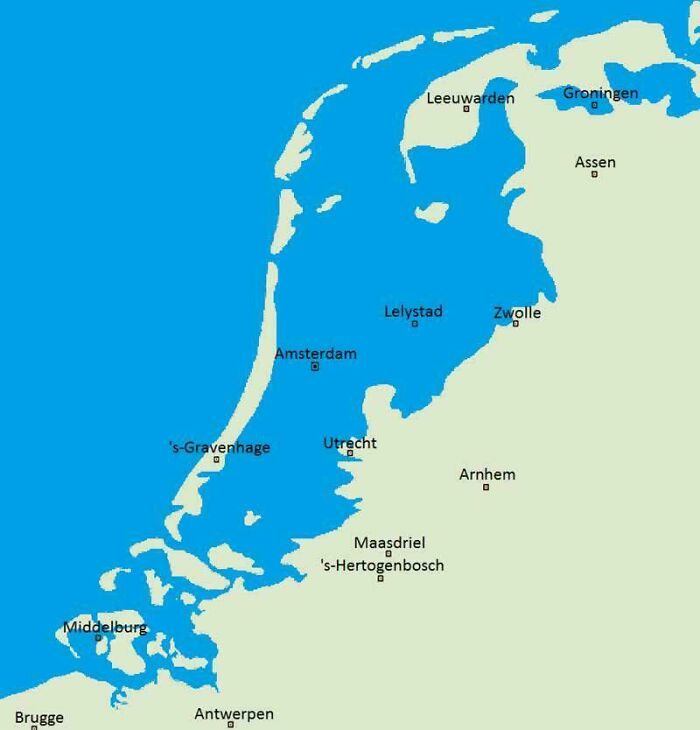
Like, which social media app is the most used around the world? What would the Netherlands look like if they hadn’t built dikes? Or what did Manhattan look like in the 1900s? Well, if these are all questions you never thought about but would love to know the answers to, we’ve compiled a list of some of the coolest and most interesting data maps for your inner nerd to appreciate.
This post may include affiliate links.

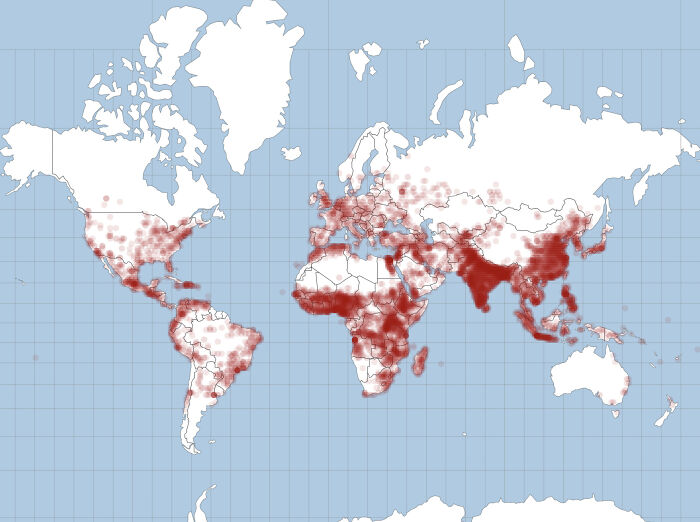
Oh sh**. Not too many decades ago I read that "rabies is the rarest of the once common diseases". Back then it was endemic in India, Pakistan and Nigeria, and was starting to make inroads into Eastern Europe. All of the Americas, all of East Asia and North Asia was rabies-free. Even about half of Africa was rabies-free.
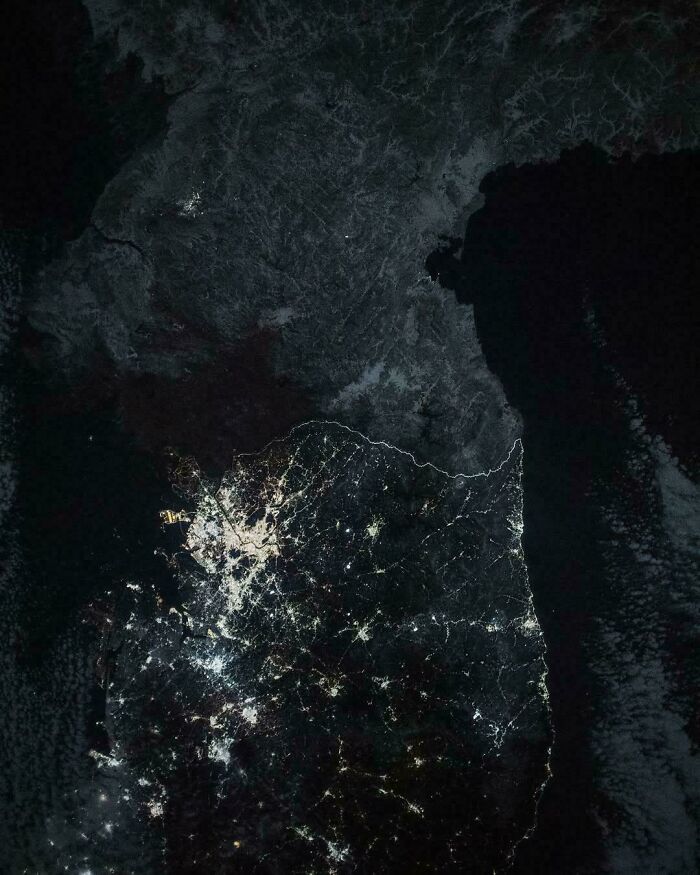
Not by "an astronaut". Almost certainly by the unmanned Suomi NPP satellite. The project involving the removal of artefacts such as clouds is known as the "black marble" project. The difference in night lighting between North and South Korea is real, I noticed it about 20 years ago. A direct consequence is that North Korea is a haven for nocturnal animals, South Korea isn't.
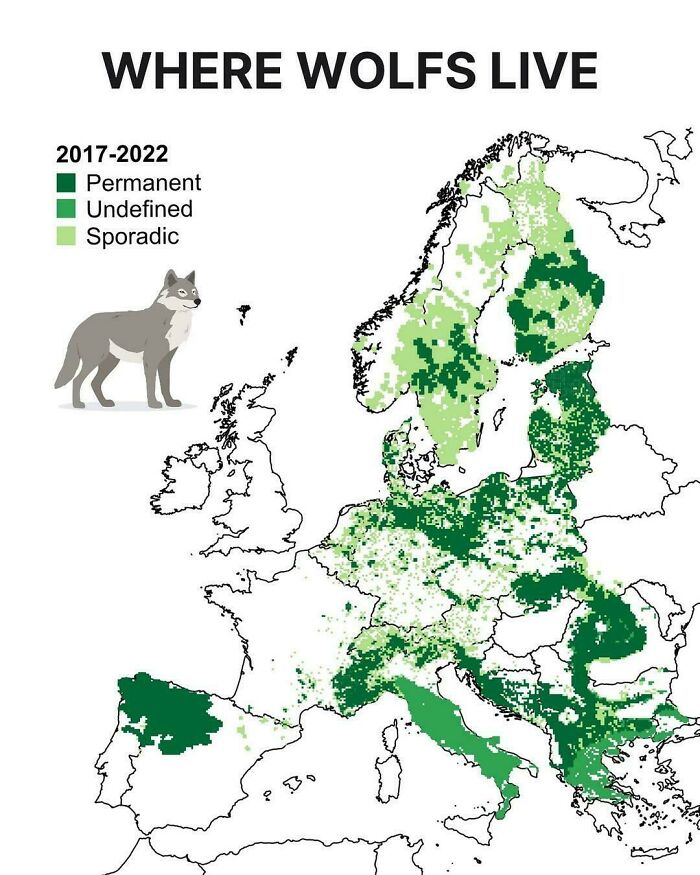
These maps weren’t just created out of sheer curiosity. Sure, they’re made by people who are fascinated by fun facts, but gathering the necessary data is a real job with some important rules behind it. For a map that tracks the presence of wolves, for instance, wildlife tracking and biological sampling create these thematic maps.
In Europe, the LCIE, or the Large Carnivore Initiative for Europe, analyzes DNA samples and camera-trap logs for its data. EU member states must also report on the conservation status of protected species every six years, adding to the available statistics and numbers. All of this is public information that netizens can access and use to create their own maps and data visualizations.
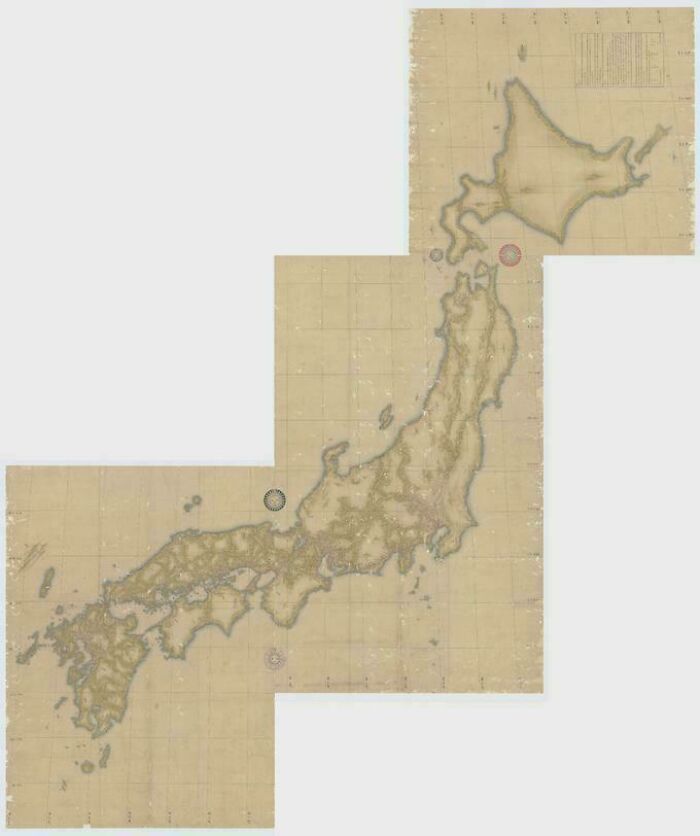
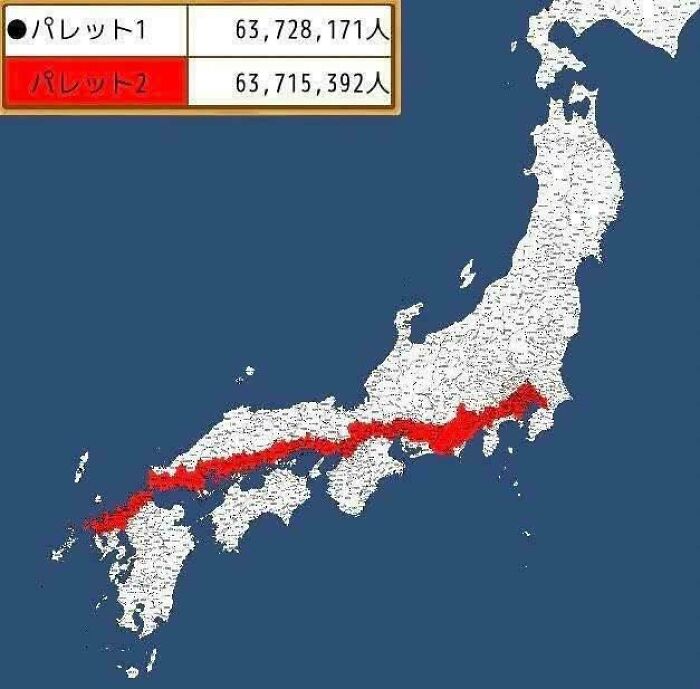
The Wikipedia entry on Inō Tadatak is worth reading. He used (then) modern surveying techniques over a period of 17 years. The map of the entire coastline of Japan was completed 3 years after his deadening, by his surveying team.

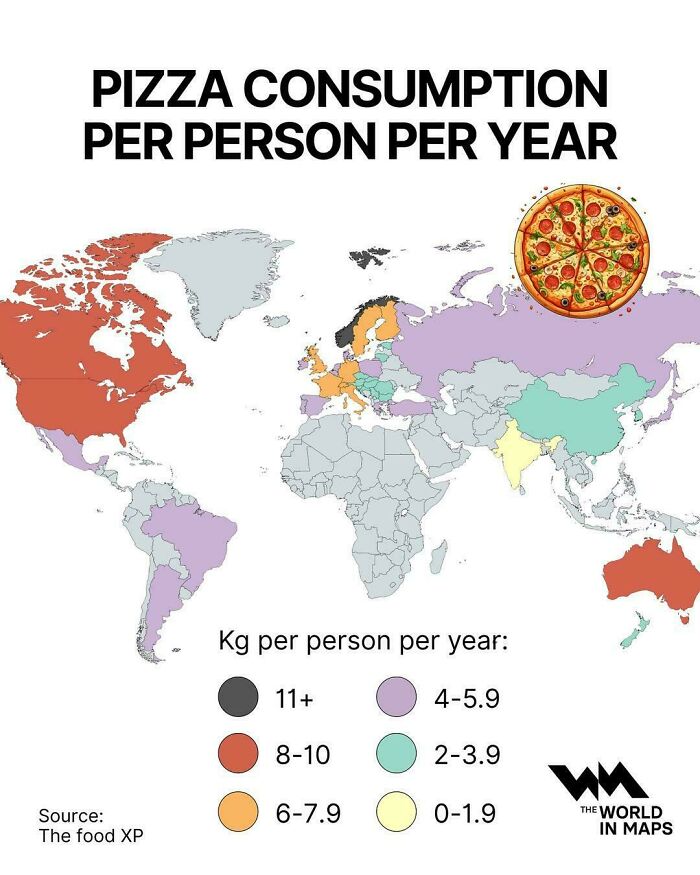
Looks like a weirdly misshapen pizza with the crust on the long side! Mmm, pizza.
But why do people create these maps in the first place? Well, according to psychologists, it all comes down to mild anxiety. No joke. The human brain is constantly trying to reduce uncertainty. This means the unknown and the unpredictable can be daunting for most people, so seeing aggregated data is a way for your brain to organize information and feel more comfortable.
Charles Berger and Richard Calabrese developed this theory in 1975. In their book, they detail how humans actively search for information to eliminate ambiguity. This way, they can gain a sense of control over unpredictable environments and organize facts that would otherwise trigger anxiety.

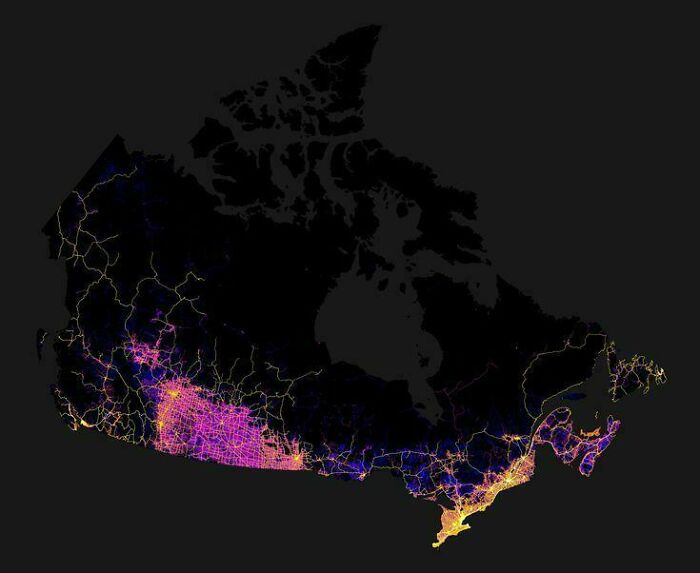
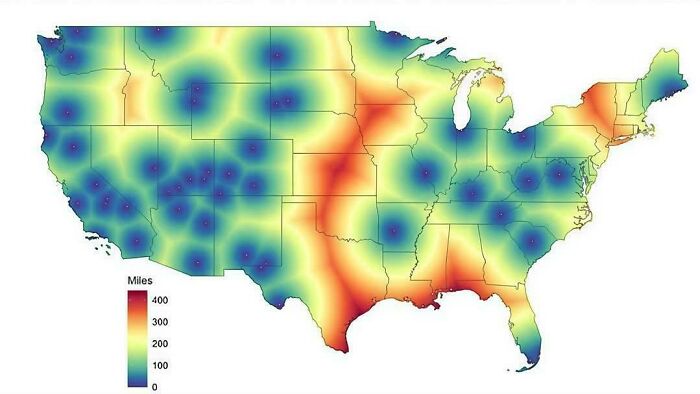
From southern Ontario, not cutting across the US, it takes two days driving to make it into manitoba
Curiously, though, map creation can almost be seen as a tool for human safety. In 1948, Edward C. Tolman developed the theory that both people and animals build internal spatial representations of the environments they live in. By creating these “cognitive maps,” as he called them, they can navigate threats and rewards.
This doesn’t necessarily mean it’s a map to follow or a way to pinpoint where a threat is. The reward can simply be the feeling of security that comes from knowing where you are going and what to expect along the way. Ultimately, it’s a tool designed to make information visually intuitive.
While we can now access any and every map, this navigation tool actually dates back to prehistoric times, showing how important they were for mental orientation. Historians believe the earliest surviving depiction of the known world as a geographical map is the Babylonian Map of the World, often called the Imago Mundi.
It was originally discovered in Sippar, Iraq, and etched onto a small clay tablet. Granted, it doesn’t necessarily look like our standard map, though. It places Babylon right at the center of a circle, with triangles beyond the river that are thought to represent mythical lands or islands that people didn’t recognize or know much about at the time.

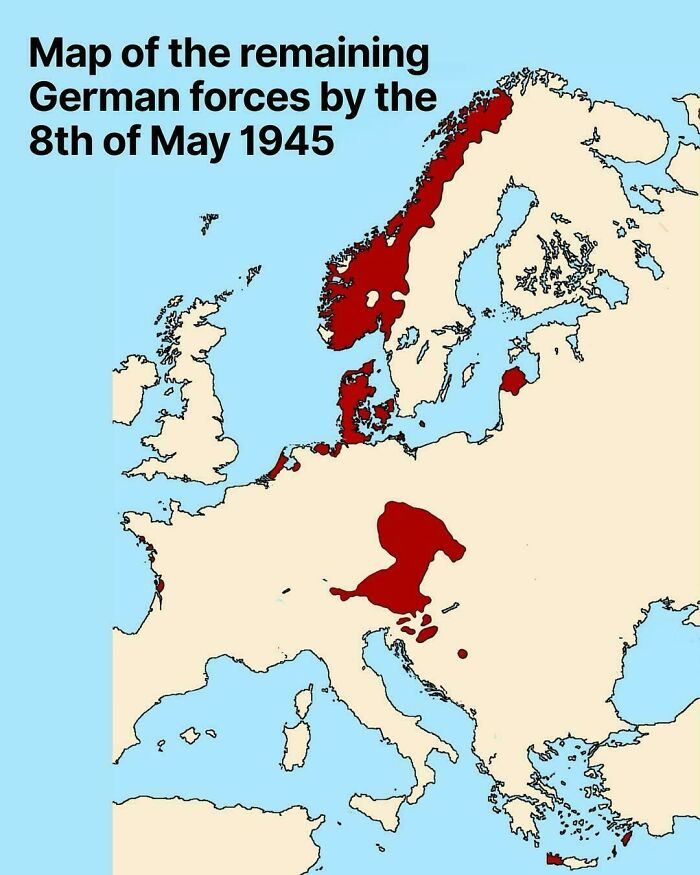
False! Denmark was liberated on the 5th of may 1945 from the germans. The Russians stayed on Bornholm until april 5th 1946.

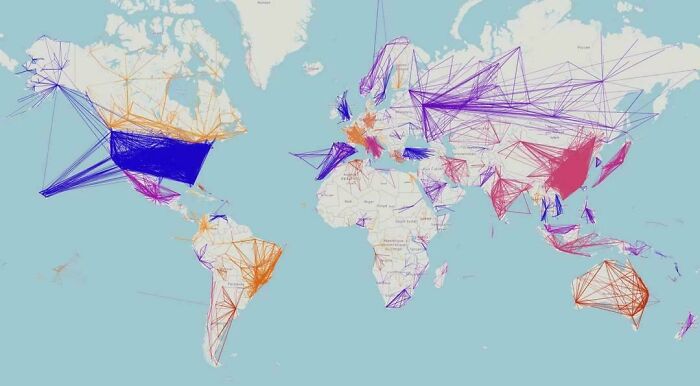
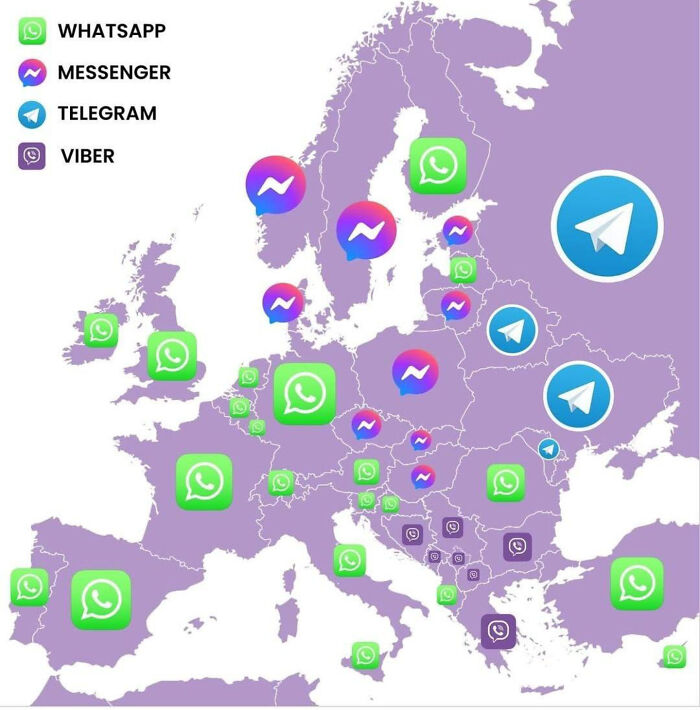
Telegram? Russians I deal with prefer WhatsApp (Serbian-based business owners from Russia)
But of course, when we think of maps, we think of pirates. And perhaps many of us believe maps were a pirate thing, created only in those centuries. After all, when you think of maps, you might immediately picture burnt edges and a giant “X marks the spot” pointing to buried treasure, right? But experts say that’s only a myth.
Historians say the only pirate known to have buried treasure was Captain William Kidd, and that was only because he was set to be executed. Aside from that, 17th- and 18th-century pirates didn’t create treasure maps at all. Who knew?
But well, after looking at all this data and all these maps, which one surprised you most? Which one did you find the most interesting? Let us know in the comments!

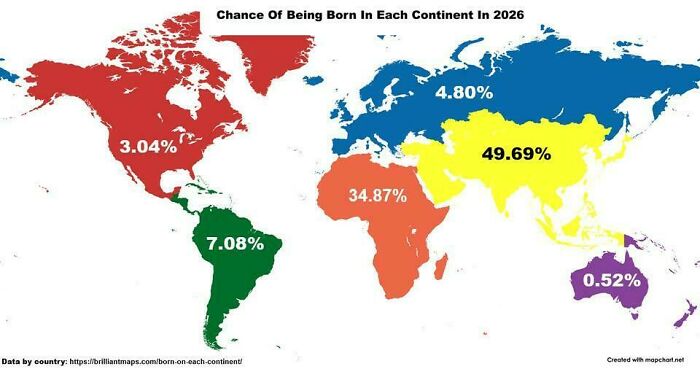
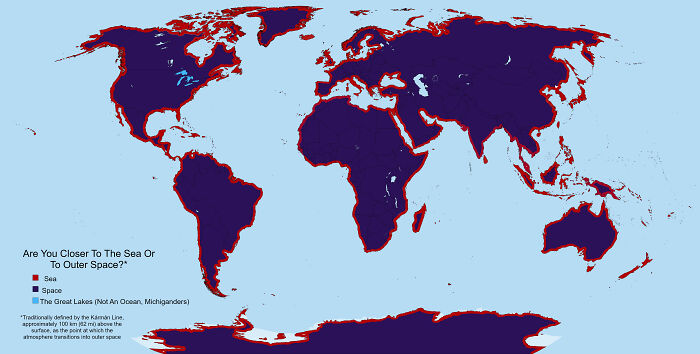
why are people shocked that a majority of a population lives near the water? anywhere that people immigrated, or "discovered" they mostly established themselves nearest the water. look at the most populated cities in canada/usa; all along the coast or a riverbed.. it made no sense to travel further up without the means, and to remain close to your boat.

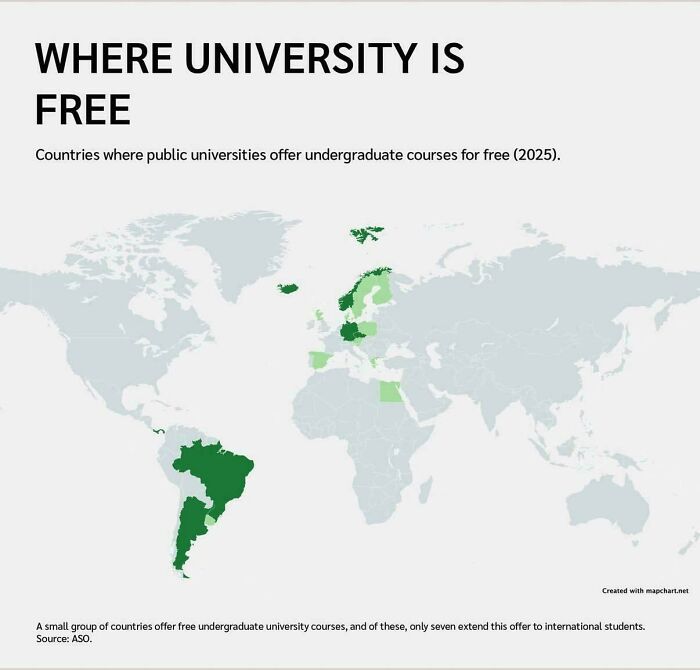
My three older siblings all went through university in Australia for free. As a result that's what I thought was normal. I was wrong. It was free for 15 years, from 1974 to 1989. They were tertiary students at the right time! I would have been too but I went straight into the workforce.
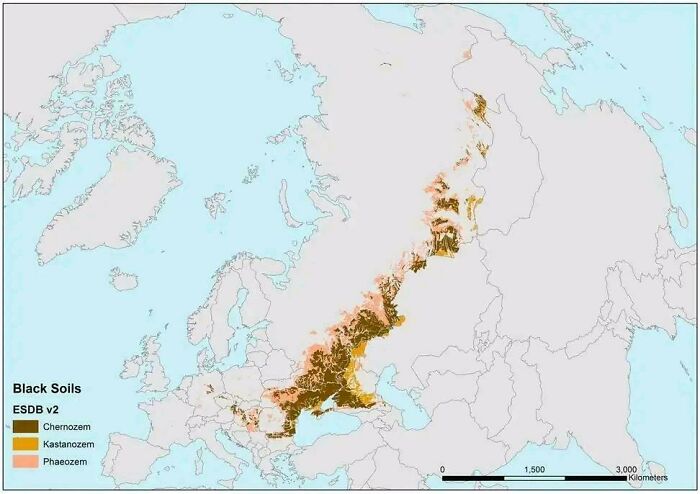
"Chernozem", geez that brings back memories. I see now why people have been fighting over Ukraine and the Crimea since the 1850s.

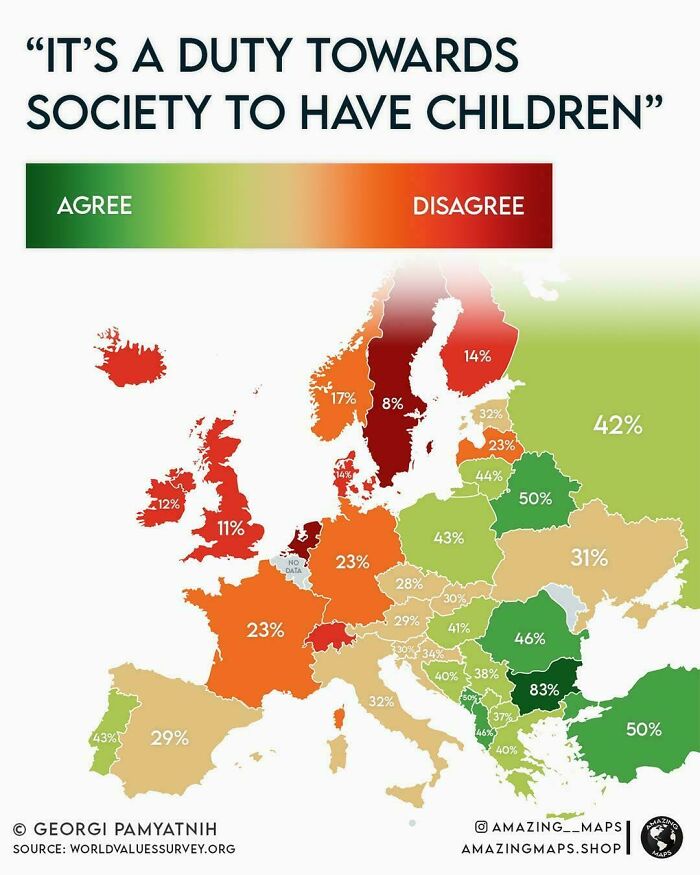
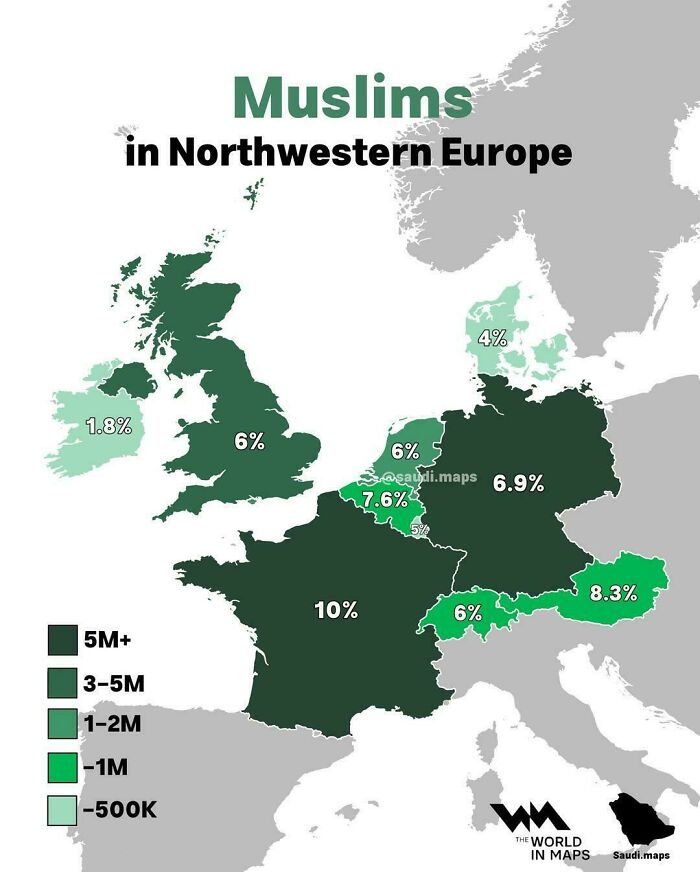
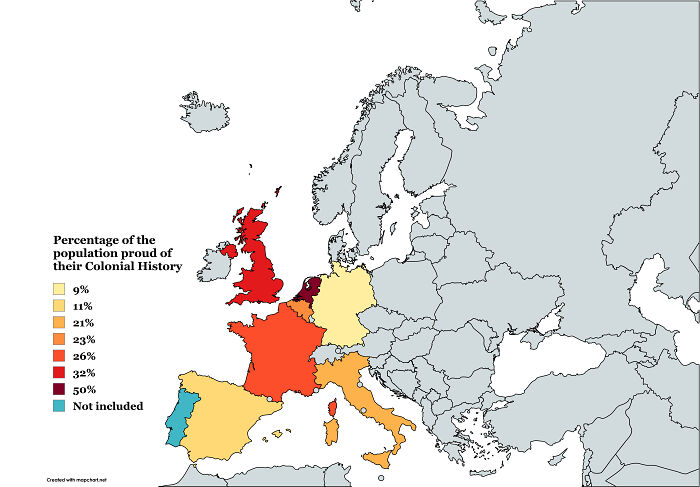
I concur with the findings for my home-country, Belgium : 'none of yous business'

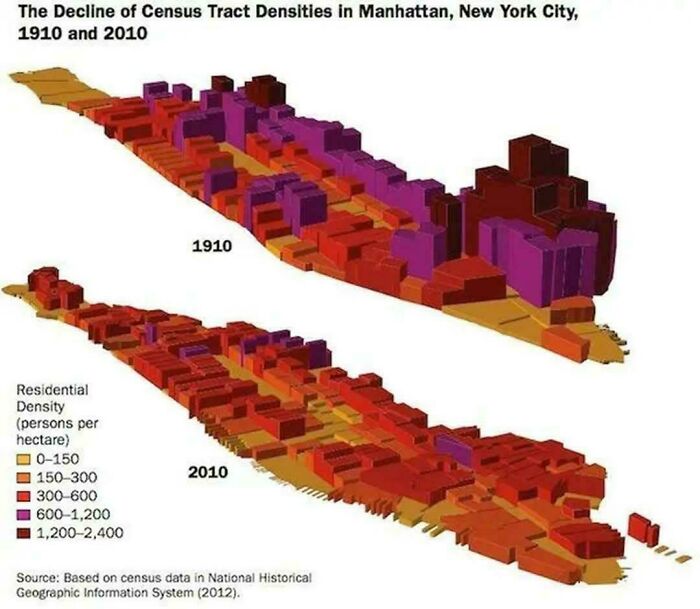
thats bc they built up the other boroughs, connected bridges, and made Manhattan more offices and better housing that overvcrowded slums. My grandmother grew up in a 1 bedroom apartment in the 1920s with her parents, siblings, and a boarder they took in to make rent, all crammed in (until they saved enough money to move to a 2 bedroom larger apartment in a poor but not slum area)
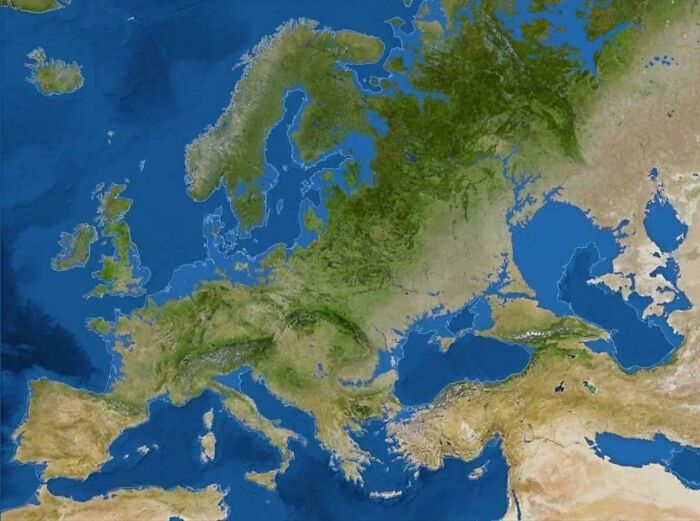
Nope. Isostatic rebound (the slow rise of land after the end of the last ice age) would change this significantly.

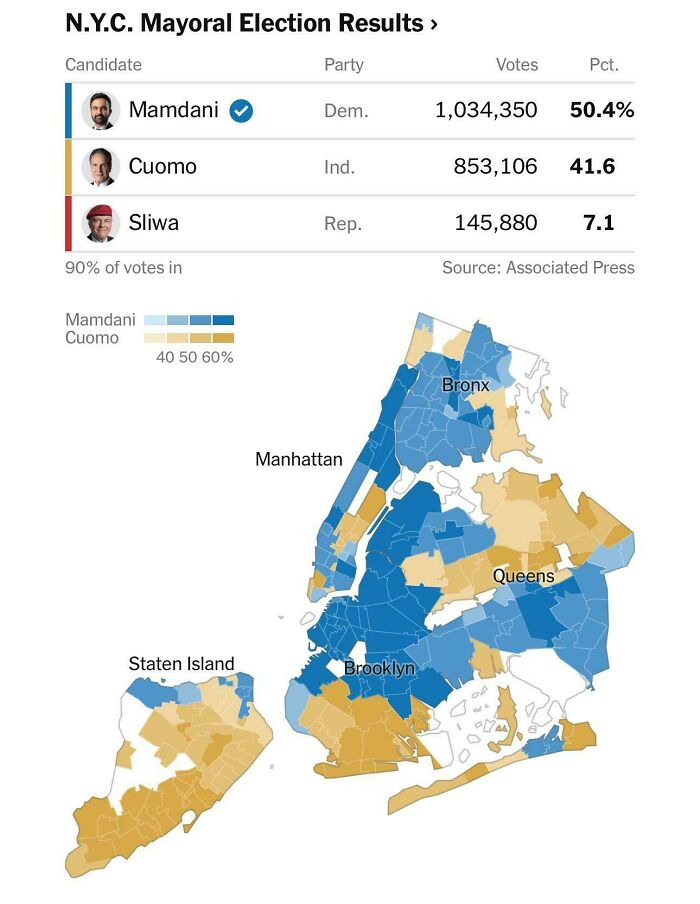
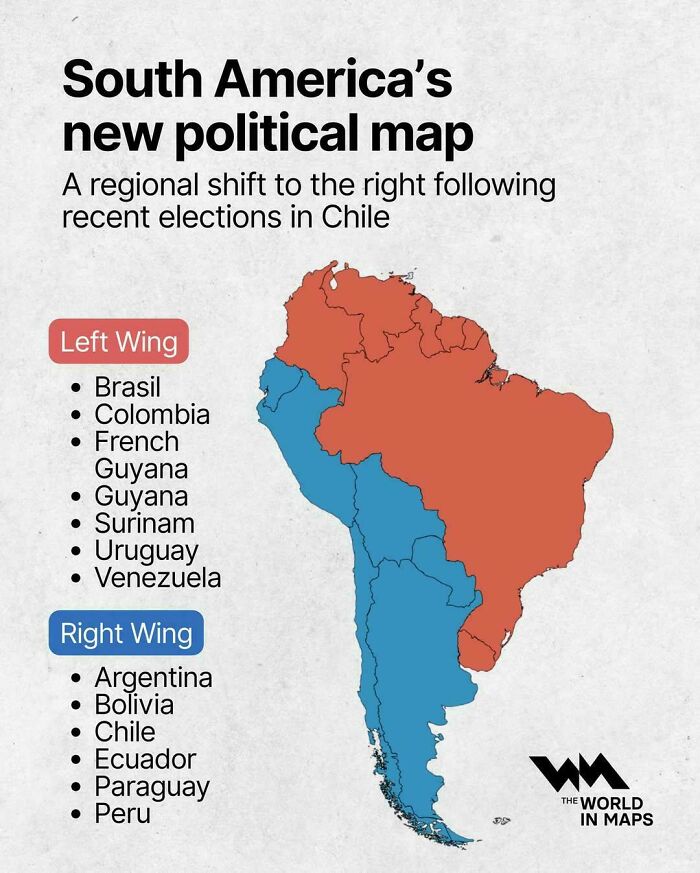
So let me get this straight....the right are on the left and the left are on the right. Pretty much sums up politics thee days
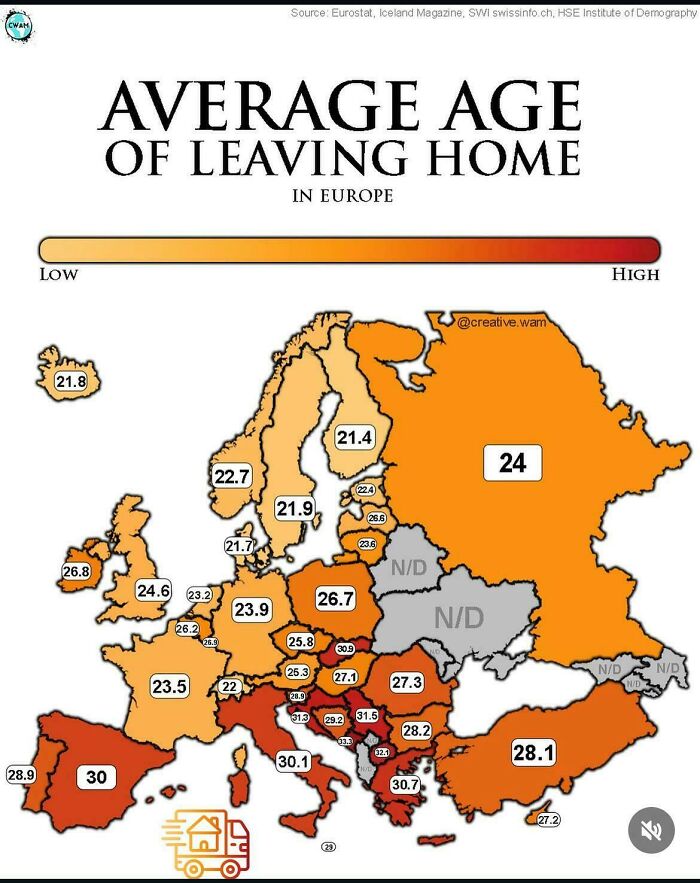
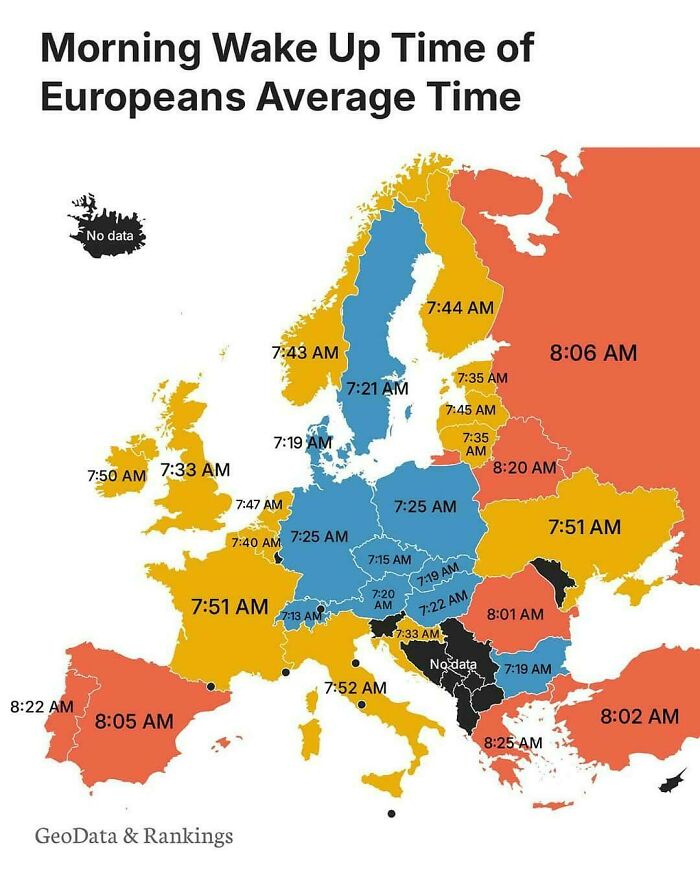
5.30 here (UK). I have lots of animals to tend to before work.

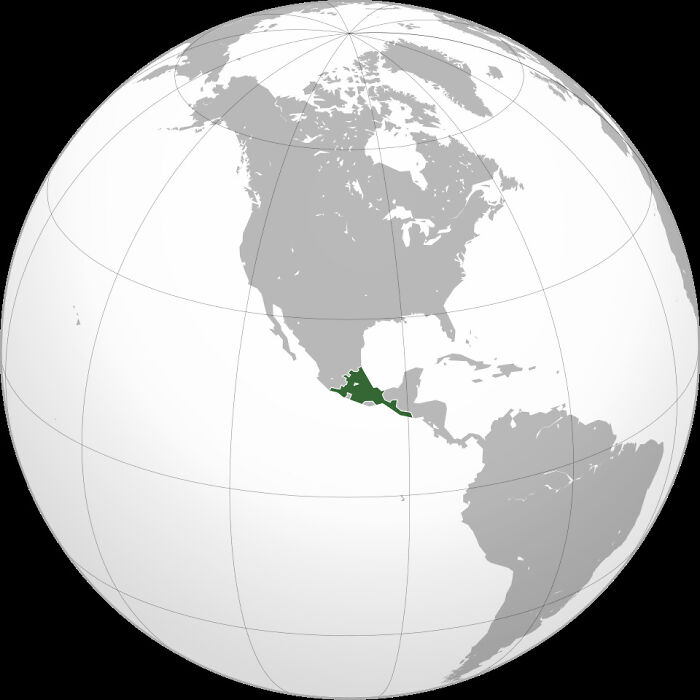
And the useful idiots in America claim that much of the SW US was once Aztec land.
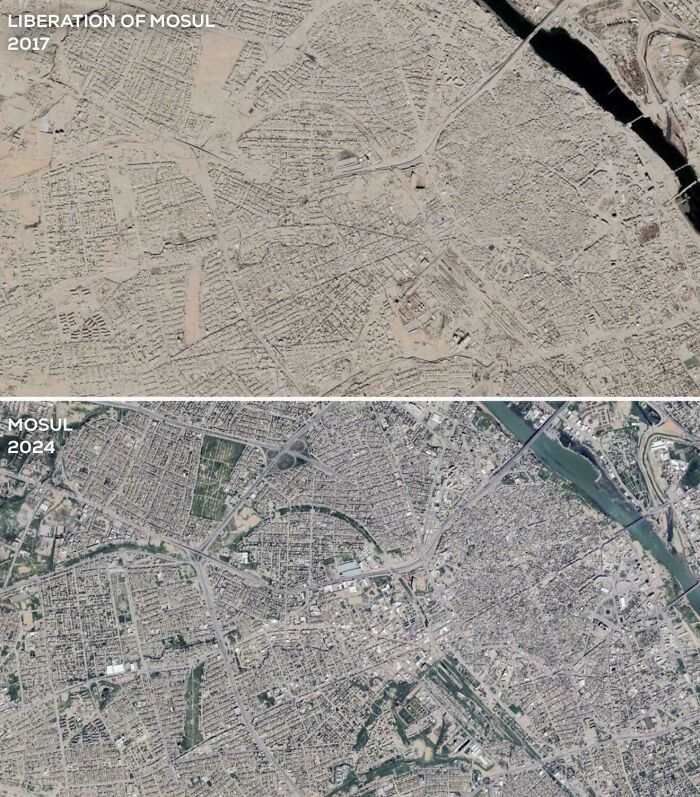
What month was each photo taken? Summer in the first and spring in the second?

The one place that hasn't been corrupted by capitalism... 🌠SPAAAAACE! 🌠





































 No fees, cancel anytime