Charts and graphs are visual representations of data. We learn about them in the school and often see them in presentations, news and ads. But, did you know they can also be used to explain our world with a little bit of humor? Have a look at these 14 hilarious charts and graphs that are sure to make you smile :)
More info: infogr.am
Time spent by a printer

“I’m on my way” meaning

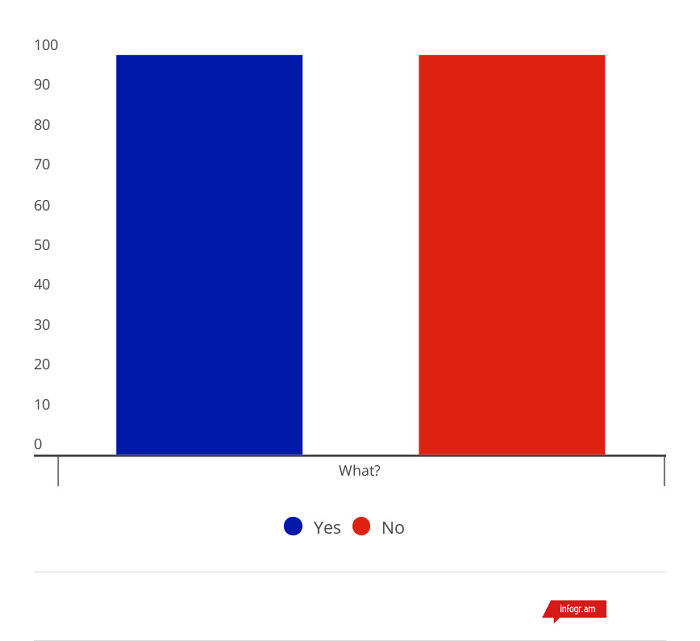
Does this look like the French flag?

Which is which?

Is it Pacman?

Egyptian Pie Chart

The reaction people have when I say I’m vegetarian


Content of a Pop song


Type of football/soccer injuries

Winners of Miss Universe

What smoke detectors warn you about?

What happens when you press the “close door” button on an elevator?

4Kviews
Share on Facebook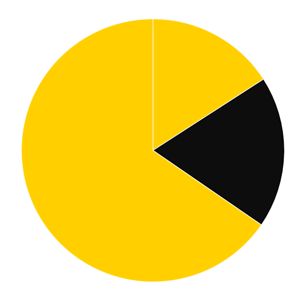
You May Like 50 Times Mannequins Made Shopping More Fun (New Pics) 30 Kids That Were Way Too Young To Understand What Was Going On, But Commented Anyway
Akvile Petraityte 🇺🇦
Gabija Saveiskyte
Popular on Bored Panda
Share your thoughts


23
1