Get Premium
Dark mode theme is available exclusively for premium users. Learn more about the benefits of subscribing.
No fees, cancel anytime.

 Dark Mode Ad-Free Browsing Unlimited Content
 Ad-Free Browsing Unlimited Content Dark Mode
Join 1.2 million Panda readers who get the best art, memes, and fun stories every week!
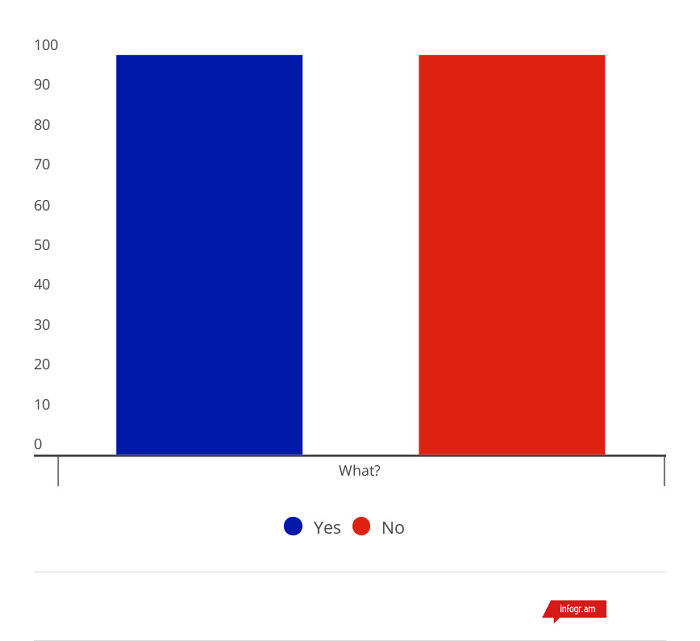
Charts and graphs are visual representations of data. We learn about them in the school and often see them in presentations, news and ads. But, did you know they can also be used to explain our world with a little bit of humor? Have a look at these 14 hilarious charts and graphs that are sure to make you smile :)
More info: infogr.am
4Kviews
Share on Facebook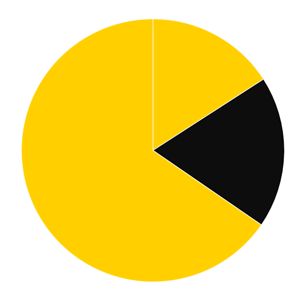


 No fees, cancel anytime


23
1