206Kviews
35 Unusual Maps That Might Change How You See The World, As Shared In This Online Account
There’s something about maps that keeps capturing our imagination again and again. Maps not only tell the stories in the most subtle and informative ways, they put things into a unique perspective we may not have ever thought of before.
So today we present you with a treat for your inner cartographer–the Twitter page dedicated to sharing “maps that keep you updated.” The creators of the page with a 36.1K-solid fan base also run a super popular Facebook page by the handle @IFLOVEMAPS. Here more than 757k people follow their content on a daily basis, which includes “keeping them updated about global events via maps,” “sharing maps developed by others” and providing them with “a new perspective on the world every day.”
Below we wrapped up some of the most interesting and informative maps shared on this page, so scroll down below and upvote your favorite ones!
This post may include affiliate links.


To find out more about the team behind the IFLOVEMAPS Facebook page and Twitter account, we reached out to the creators, Pablo Izquierdo and Lars Erik, who have been developing maps together for over a decade. The duo lives in Oslo and Madrid and they have a company called Mapographics that delivers services in the GIS-space (GIS = Geographical Information Systems).
Pablo explained that the main goal of Mapographics is to make maps that are informative, educational, and hopefully also nice to look at. “We have developed a lot of maps and analysis in the sustainability domain, and lately we have also started to sell maps for decoration. We love to merge scientific data with design,” he told Bored Panda.


I remember doing Technical Drawing in high school, such a lost art now.
The birth of IFLOVEMAPS was ten years ago, when Pablo and Lars Erik talked about making a social media page where they could share their love for maps. “It started with a Facebook page, and then moved on to Twitter and Instagram. We’re super happy to have several hundreds of thousands of followers, which to us is only a testimonial that many people share our love of maps,” Pablo said.
When asked if it’s true that more and more people are interested in maps, Pablo explained that we live in an ever more globalized society, and the distances between us are getting smaller due to cultural exchange and technology. “In addition, themes such as those that relate to environment, climate, sustainability, man-build-environment and more, nurture more interest in the spatial dimensions of things. Maps can represent how things are tied together in the spatial dimension, or geographical sense.” He added that “we experience a much higher interest in maps, more advanced spatial analysis, and more lightly, storytelling.”

North Dakota & Montana are! Oh, & Arizona is definitely on fire April-ish to November-ish...(help us!)
Load More Replies...So, I live in Texas, in the section of "air thick as hot soup" and "nightmare tornado zone". My son goes to college In Louisiana and swears that sometimes the air there is "like breathing in macaroni and cheese". Just thick and humid. Also, mosquitoes there are insane. Texas is great though- we can have all 4 seasons in one day and every holiday is marked by gun fire and fireworks.
I love Washington with the ‘year long depression’ our weather is hilarious. Yesterday I got clouds-sun-rain-hail-clear throughout the day in like 30 second intervals.
Terror area? Nah, hurricanes aren’t scary. Tornadoes on the other hand…
A category 3 hurricane is basically an F1 tornado a hundred miles wide and takes hours to pass. Category 4 is an F2 and category 5 is an F3. This is why a tornado can blow up a few houses but a hurricane can blow up half a state.
Load More Replies...can confirm california is both on fire and the ground moves, when i was born you could see the fire from my window and i did experience a minor earthquake when i was about 4 or 5
Ah, yes. My dear California, (not so) secretly plotting to kill us. 🤪
Lived in each region and pretty good summary of what the downside is in each. Should be titled America the Beautiful, By Pessimists or something
IIRC comedian Diane Ford said her Scandanavian forebears settled in the US's upper Midwest because it was "just as f*****g miserable as where they came from." So did my Baltic ancestors before they moved to southern California i.e. to the fire zone. Moral: cold sucks.
Please stop trying to be Australia... you just aren't that big a deal.
I live on the corner of nightmare tornado zone and snow covered moonscape. 😐
Alright can someone explain the "year-round depression" and Mystery Belt?
I don’t know about the second, but ‘year round depression’ might be because a lot of Washington is cloudy and rainy year round.
Load More Replies...Up at the top, the rain isn’t really depressing. It’s honestly really pretty and we also have fairly ok summer.


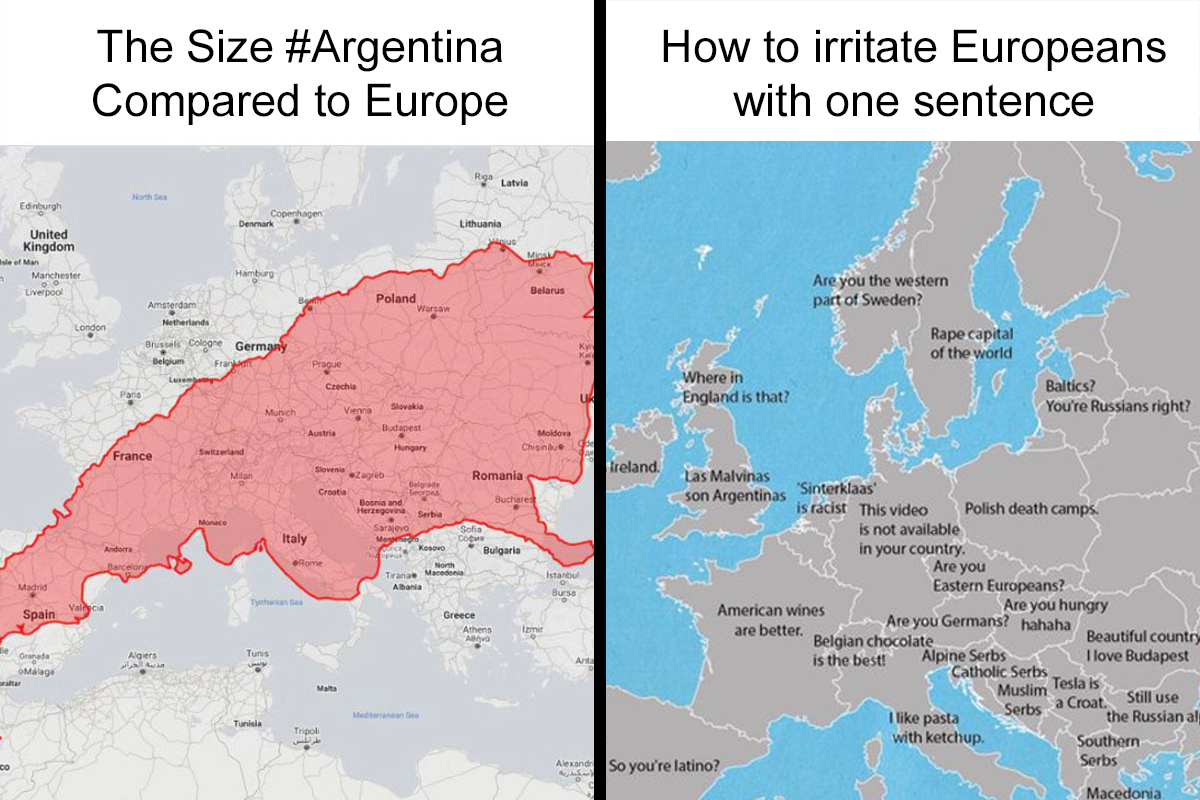
Pablo explained that “from a social media point of view, people love maps that are spot-on in conveying a message of stereotypical characteristics and differences between countries. From a more professional point of view, the interest in sustainability related topics in maps has skyrocketed in recent years, such as maps showing degradation of nature or the effects of climate change. But more generally speaking, what we see is that maps, as a way to represent data or tell a story, are increasingly used in media, by the government, NGOs and even in the business community.”


I wish there was a key to see how many people each height equates to

But making a good map that is based on advanced data, that tells a story and that looks good (or at least tries to) is a process of trial and failure, Pablo argues. “To put it simply, the process starts from the idea on what story/data the maps should express, to identification of data source, quality assurance, data processing, GIS processing, and working to ensure the final print has crisp and flawless details when it turns into a final product.”

This is really lovely. Too bad their habitat is being destroyed daily.


but yet the standard of living is lower in the US. I woudl rather have lower income than go bankrupt after a cancer diagnosis or be one of the 56% of homeless people who have full time jobs. -American living abroad

If you are born in France and live there until 18, you are automatically French.

Ah, I see the Maritimes have been remembered! Finally. (I'm joking, everybody knows the Maritimes)


Not true! In today Romania was the Dacian language, which was Not Slavic and then it was combined with Latin -> Romanian language. It is a big part of the Eastern Europe!


I’m going to start calling Ferraris “Smiths” and nobody will understand but me


Give me a word, any word, and I show you that the root of that word is Greek. -Gus Portokalos


This is country perspective based. Didn't see squat about western tragedies or news when living in China, found out about them from western sources. My relatives in Malaysia don't hear any either unless we tell them; get lots of "omg world is inbdanger!" stuff when it's in Malaysia, Indonesia, Philippines, India, China, Thailand, or Vietnam though. Lots about coups and stuff in Thailand and Myanmar get reported there as terrible for the world.


So everyone went to pretty much the same places? (Except looks like the Dutch weren't that much interested in North America)


Note: this post originally had 113 images. It’s been shortened to the top 35 images based on user votes.


I could probably spend the rest of my life looking at these and still forget all of it three minutes later.
Yeah these are always nice facts to look at, never remember anything after I close the page though :D
Load More Replies...I could probably spend the rest of my life looking at these and still forget all of it three minutes later.
Yeah these are always nice facts to look at, never remember anything after I close the page though :D
Load More Replies...